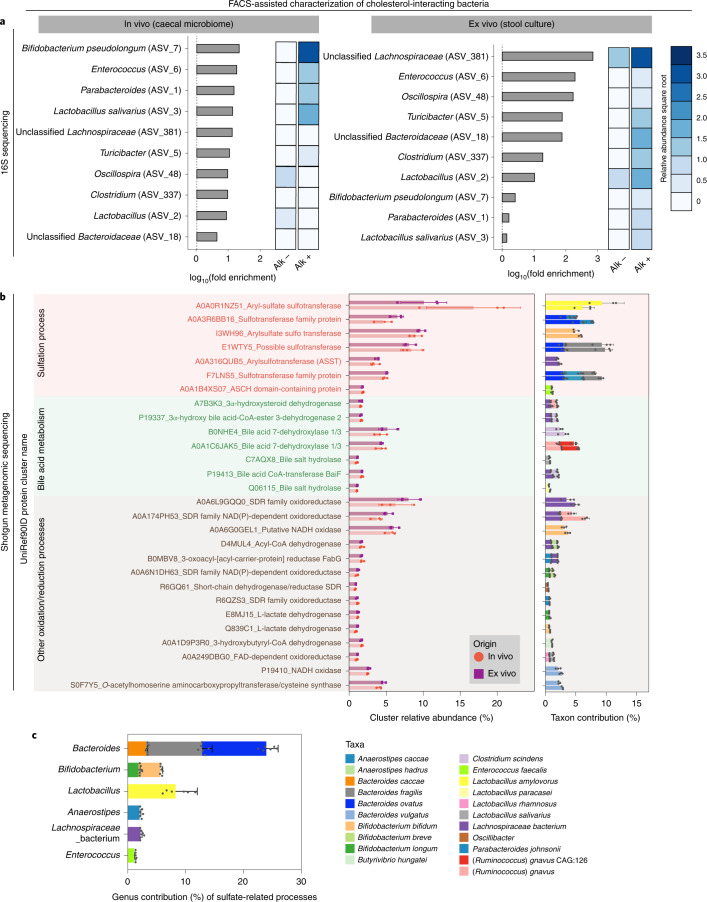
Fig. 2. Gut microbes that interact with diet-derived cholesterol.
a, 16S rRNA gene amplicon sequencing identifies taxonomic classification of cholesterol-interacting microbes enriched by FACS using the BOSSS workflow. The fold-enrichment is between relative abundances of taxa in the Alk+ fraction compared with the Alk− fraction and the heatmaps represent square root transformed relative abundances of the ASVs. Relative abundances of Alk+ and Alk− samples were averaged separately for both in vivo and ex vivo experiments (n = 3 for each sorted population). b, Metagenomic analysis identifies UniRef protein clusters associated with cholesterol-interacting microbes. The left bar plot demonstrates the relative abundance of each enriched cluster, in which the background is colour differentiated based on their grouped biochemical annotations, and the bar and dot colours indicate the sample source (n = 3 from biologically independent animals for in vivo and n = 3 for ex vivo biologically independent stool cultures). c.p.m., copies per million. The right bar plot shows the mean contribution of the species identified in the Alk+ to the corresponding UniRef protein clusters. Per-species cluster abundance values were normalized to each cluster within each sample individually, and the mean abundances were further taken across individuals. c, Per-genus contribution of all annotated sulfation processes in the Alk+, cholesterol-interacting microbiome population in both in vivo and ex vivo samples as described in b. Bar chart values are mean ± s.d.

