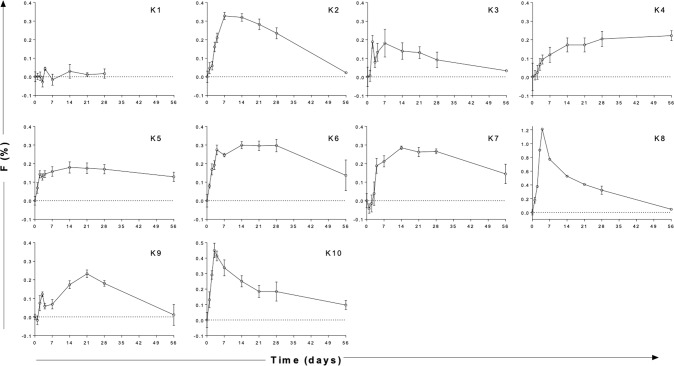
Fig. 3. Deuterium labeling in CLL cells in ten patients with non-progressive disease.
DNA deuterium enrichments in purified CLL cells from 10 subjects (K1–K10) without intervention. Data are expressed as fraction of new cells produced (F, as a percentage) normalised by the glucose enrichment area under curve to the equivalent of one day’s labeling, i.e. equivalent to %/day. Note different axes for K8 and K10. Cycle 2 results were similar (Supplementary Fig. 2). Time represents days following oral labeling with deuterium-labeled glucose (labeling day = d0); error bars represent the standard deviation of at least four replicate measurements by GC-MS (error bars not shown where they are smaller than the symbols).

