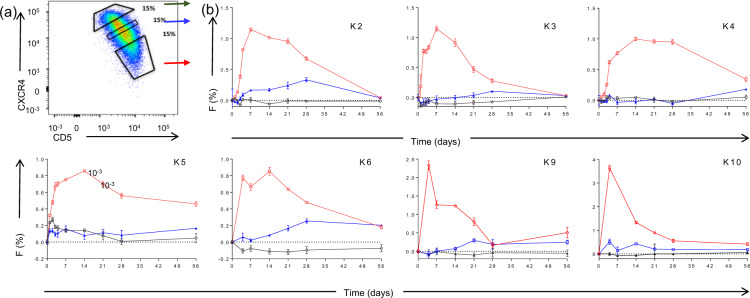
Fig. 4. Deuterium labeling for CLL subpopulations defined by CXCR4 and CD5 expression.
a Sorting protocol for CLL cells according to reciprocal and intermediate expression of CXCR4 and CD5. Gates were set to collect 15% of events within each subpopulation: CXCR4lo/ CD5hi (red arrow), CXCR4int/CD5int (blue arrow), and CXCR4hi/CD5lo (green arrow). b Deuterium enrichment curves of sorted CLL cells: CXCR4loCD5hi (red circles), CXCR4intCD5int (blue squares), and CXCR4hiCD5lo (green triangles). Results are shown from 7 subjects (K2, K3, K4, K5, K6, K9, and K10), expressed as fraction of new cells (F %) normalised to one day’s labeling; error bars represent the standard deviation of ≥4 replicate measurements by GC-MS. The F scale varies between subjects to best represent deuterium enrichment. Time represents days post-labeling. Note that K5 had a dual population of CLL cells.

