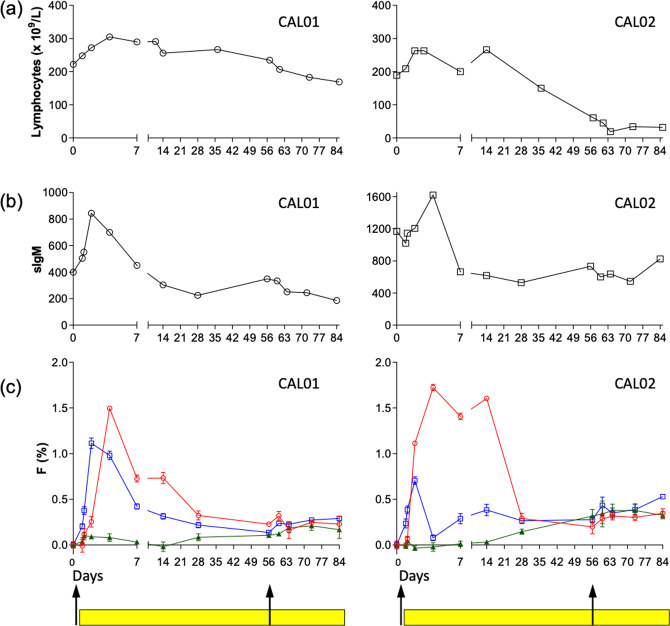
Fig. 6. Kinetics of lymphocytosis, median sIgM expression and deuterium enrichment in CLL cells following treatment with idelalisib (CALiBRe study).
Results are shown for 2 subjects: CAL01, left panels, and CAL02, right panels, pre- (day 0) and up to 84 days post-treatment with idelalisib: (a) Total lymphocyte count; (b) Median expression of sIgM; (c) Deuterium enrichment in sorted CLL cell subpopulations: sIgMhi (red circles), sIgMint (blue squares), and sIgMlo (green triangles). Data are expressed as fraction of new cells (F %) normalised to one day’s labeling; error bars represent the standard deviation of ≥4 replicate measurements by GC-MS. Black arrows denote oral administration of deuterium labeled glucose. Yellow bars represent administration of idelalisib which was commenced 24 h after the commencement of deuterium labeling. Time points represent days post- first deuterium labeling (day 0).

