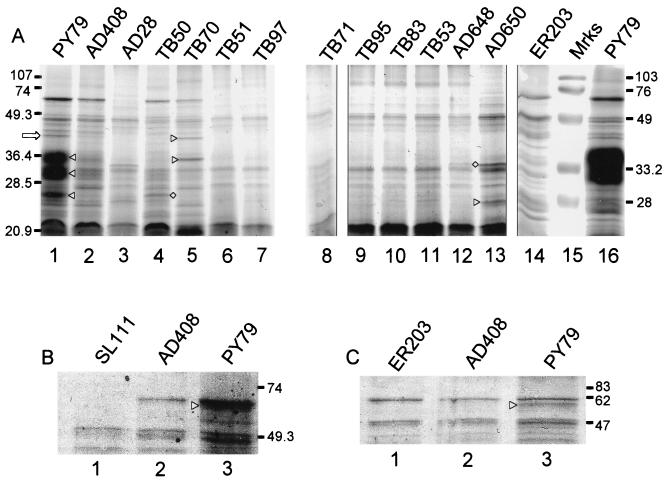
FIG. 4.
SDS-PAGE analysis of spore coat extracts. Coat protein extracts were electrophoresed on 15% polyacrylamide gels. Extracts in each lane were prepared from spores of the indicated strain. (A) Coomassie blue-stained acrylamide gel. Lane 15 contains markers. The open arrow indicates CotS and the triangles between lanes 1 and 2 indicate the positions of bands of about 36, 30, and 26 kDa, discussed in the text. The triangles between lanes 4 and 5 indicate the positions of YvdO (upper) and YveN (lower) and the diamond indicates YrbB. The diamond between lanes 12 and 13 indicates the 31-kDa band, and the triangle indicates the 25-kDa band. Molecular masses indicated on the left are for lanes 1 to 13, and those on the right are for lanes 14 to 16. (B) Upper region of an SDS-polyacrylamide gel showing the consequence of deletion of cotA in AD408. (C) An experiment in which CotA and CotB were successfully resolved. In panels B and C, triangles indicate the positions of CotB. Molecular masses are indicated in kilodaltons.

