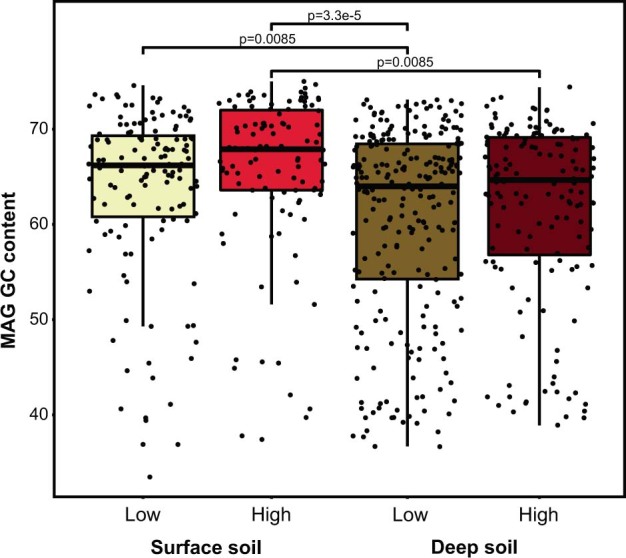
Extended Data Fig. 5. MAG GC content higher in MAGs reconstructed from high severity-impacted surface soils.

GC content of MAGs reconstructed from each condition. P-values are indicated between conditions if there are significant differences (one-sided pairwise t-test, p < 0.05). The lower and upper hinges of the boxplots represent the 25th and 75th percentile and the middle line is the median. The upper whisker extends to the median plus 1.5x interquartile range and the lower whisker extends to the median minus 1.5x interquartile range. Jittered points represent individual MAGs (n = 131 reconstructed from Low S samples, n = 111 from High S, n = 247 from Low D, n = 148 from High D).
