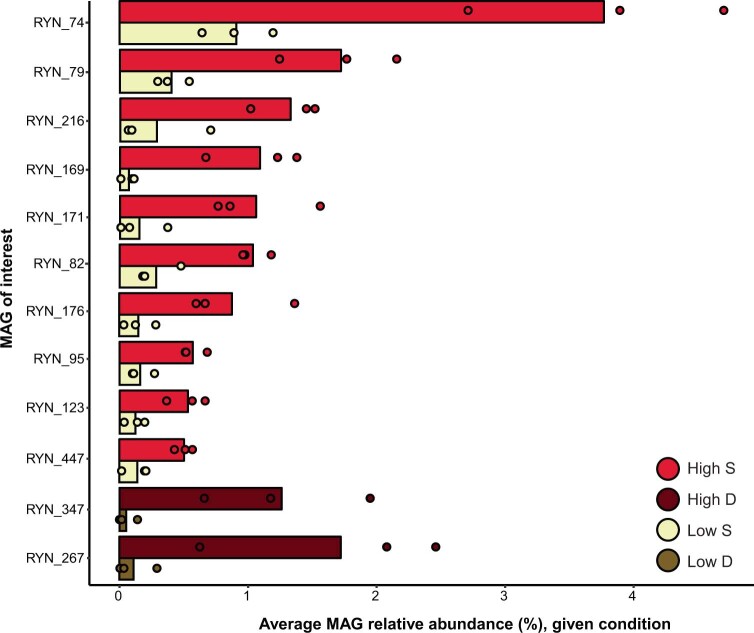
Extended Data Fig. 4. Average relative abundance of MAGs of interest across severities.
The relative abundances in Low and high severity of MAGs that are significantly enriched (one-sided pairwise t-test; p < 0.05; p-values in Supplementary Data 2) in High S vs. Low S (7 MAGs) or High D vs. Low D (2 MAGs) that match the designated criteria for discussion in the text (average relative abundance > 0.05% and standard deviation less than average relative abundance). Overlayed points show relative abundance of MAGs in each samples (n = 3 for each condition).

