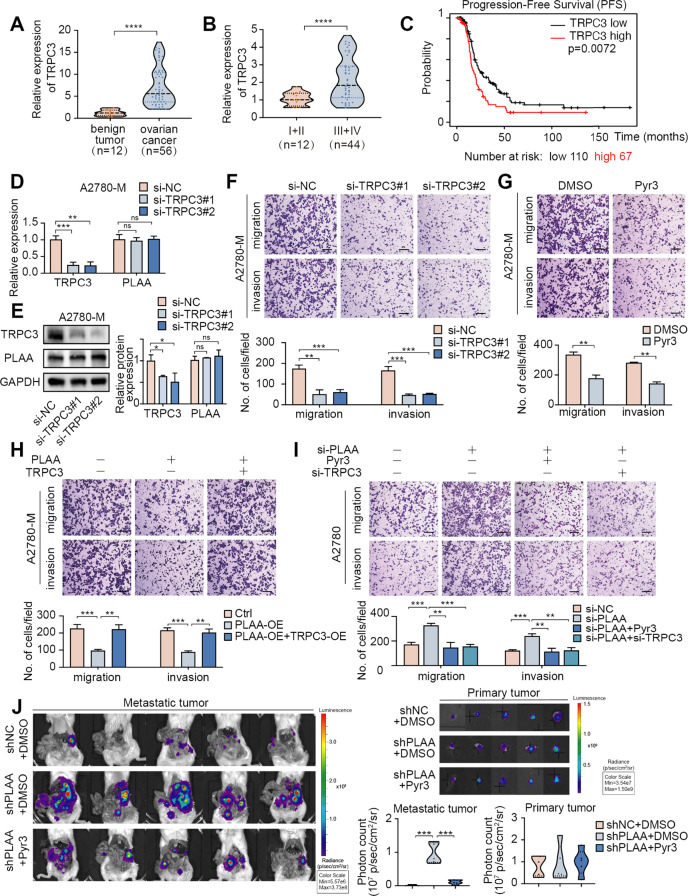
Fig. 4. TRPC3 behaves as an oncogene and acts as a downstream target of PLAA.
A RT-qPCR analysis of TRPC3 expression in 56 tissue samples of ovarian cancer and 12 tissue samples of ovarian benign tumor. B RT-qPCR analysis of TRPC3 expression in ovarian cancer tissues of late stages and early stages. C Kaplan–Meier analysis of progression-free survival of patients from TCGA data with different TRPC3 expression. A2780-M cells were transfected with two TRPC3 siRNAs or negative control. TRPC3 expression was determined by RT-qPCR (D) or immunoblot analysis (E). F A2780-M cells were transfected with two TPRC3 siRNAs or negative control. Cellular migration and invasion were detected by transwell assay. Scale bar, 100 μm. G Cellular migration and invasion of A2780-M cells treated with Pry3 or DMSO were detected by transwell assay. Scale bar, 100 μm. H, I A2780-M cells were transfected with PLAA plasmid, PLAA plasmid plus TRPC3 plasmid, and negative control, respectively (H). A2780 cells were transfected with PLAA siRNA, PLAA siRNA plus TRPC3 siRNA, PLAA siRNA plus Pyr3 treatment (2 μM, 24 h), and negative control, respectively (I). Cellular migration and invasion were detected by transwell assay. Scale bar, 100 μm. J Ovarian cancer cells were orthotopically transplanted into SCID mice, and mice were intravenously treated with DMSO or Pyr3 (5 mg/kg) for twice a week from the first week after implantation. Representative bioluminescence images of dissected primary and metastatic ovarian cancer at the time of execution. The photon count indicated the tumor burden. Data are representative of at least three independent experiments. *p < 0.05, **p < 0.01, ***p < 0.001, ****p < 0.0001, ns no significant.

