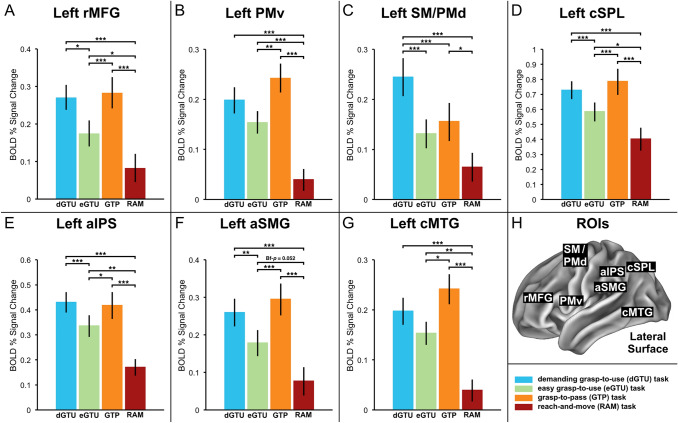
Fig. 5.
The results of ROI analyses for the planning phase. A–G Mean percent signal change within each ROI is plotted relative to the resting baseline for the following Tasks: demanding grasp-to-use (dGTU) task, easy grasp-to-use (eGTU) task, grasp-to-pass (GTP) task, and reach-and-move (RAM) task. (H) The overview of ROI locations depicted on the Connectome Workbench template brain. Asterisks indicate differences with Bonferroni-corrected p values of at least 0.05 (*), 0.01 (**), or 0.001 (***)

