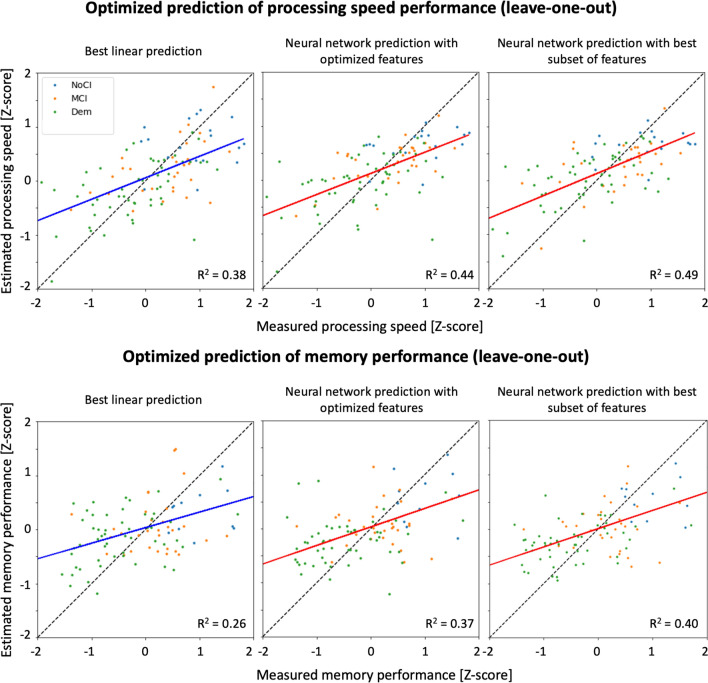
Fig. 4.
Scatter plots of measured and estimated processing speed (top) and memory performance (bottom) using the linear multivariate predictor (first column) and ANN (second and third column) with leave-one-out cross-validation. The solid line is the regression line, and is colored in blue for multivariate prediction (left), and in red for ANN prediction (middle and right). The colored dots represent each included patient and are colored encoded according to the clinical diagnosis: blue for no cognitive impairment (NoCI), orange for mild cognitive impairment (MCI), and green for patients with dementia (Dem). The best multivariate prediction (left) included demographics, lesion and atrophy markers and average MD in WM, and is compared to predictions with the neural network using all candidate metrics (middle), and the best subset (right)

