. 2020 Apr 13;2(6):2352–2362. doi: 10.1039/d0na00147c

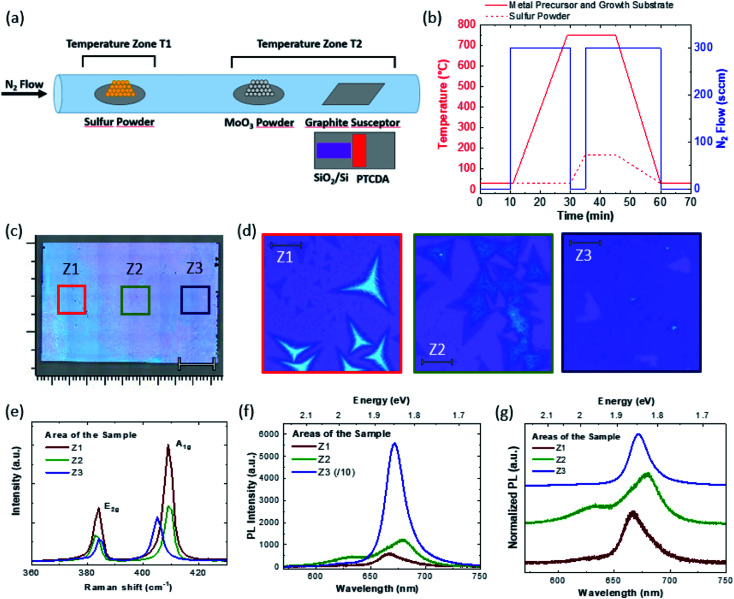
Fig. 1. (a) Schematic illustration of the CVD reactor, with the configuration of the sulfur and Mo precursors and the disposition of the different substrates (b) Temperature (red lines) of the sulfur precursor (dashed line) and of the growth substrate (full line) and N2 carrier flow (blue line) during the growth process (c) optical image of the growth substrate, a different contrast induced by the presence of MoS2 is reported. The marker is 200 μm. (d) Optical images of the three areas named Z1 to Z3 highlighted by the colored squares in the panel (c). All the markers are 20 μm. The area Z1, the farthest from the PTCDA sacrificial substrate, shows the presence of MoS2 multi-layered dendritic structures and micrometric triangular monolayers, and the optical image of Z2 shows the presence of triangular crystals affected by overgrowth. Z3, the closest to the PTCDA substrate shows the presence of the MoS2 polycrystalline monolayer with high coverage, affected by a micrometric few-layer island, probably due to the seeding point of the crystal. (e) Large-area Raman spectroscopy spectra of the three areas in analysis. (f) Large area photoluminescence spectroscopy spectra of the same areas. The PL spectrum of Z3 is divided by 10 for the sake of clarity. (g) Normalized PL spectra.

Fig. 1