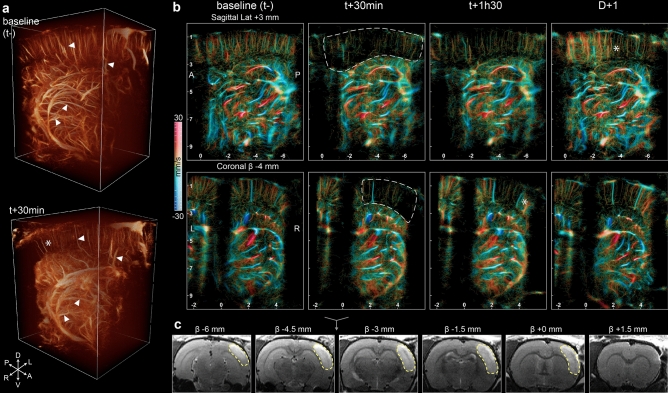
Figure 3.
The MCA occlusion ischemic stroke was observed with 3DULM at the early phase. (a) 3D renderings at before and 30 min after stroke’s induction (Supplementary Video S1). (b) Sagittal and coronal slices of 600 µm with velocity rendering at different timepoints. Ischemic cortex wrapped with a white dotted line. . Upward flows: red, downward flows: blue. (c) T2 MRI at D + 1 with the segmentation of the lesion (yellow dotted lines). Scale bar: 2 mm. Figures were created with (a) Amira 2019.4 (https://www.thermofisher.com/amira-avizo), (b,c) MatLab 2019a (https://www.mathworks.com/products/matlab).

