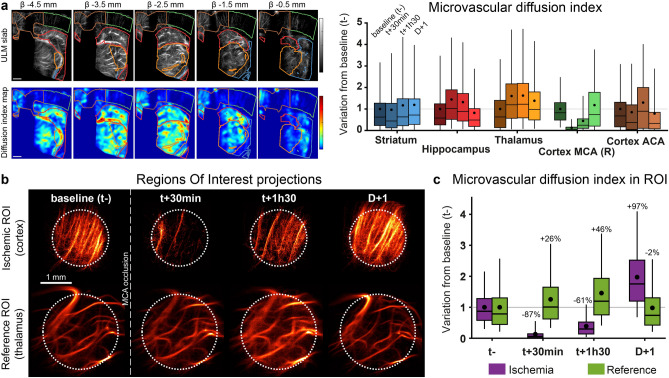
Figure 4.
Sudden and massive loss of perfusion in the cortex. (a) Coronal slices of MDI with anatomical regions. MDI values inside each region normalized with t−. Scale bar 1 mm, slices of 600 µm. (n = 1). (b) Projection of the selected ROI in the cortex and thalamus as a reference. c MDI values for the ROI inside ischemia and the reference, normalized with baseline (t−). (Results of the analysis of 1 animal over 4.) Box plot: mean (dot), median (line), 1 and 3 quartile (box), 5 and 95% (whiskers). Figures were created with (a–c). MatLab 2019a (https://www.mathworks.com/products/matlab).

