Figure 6.
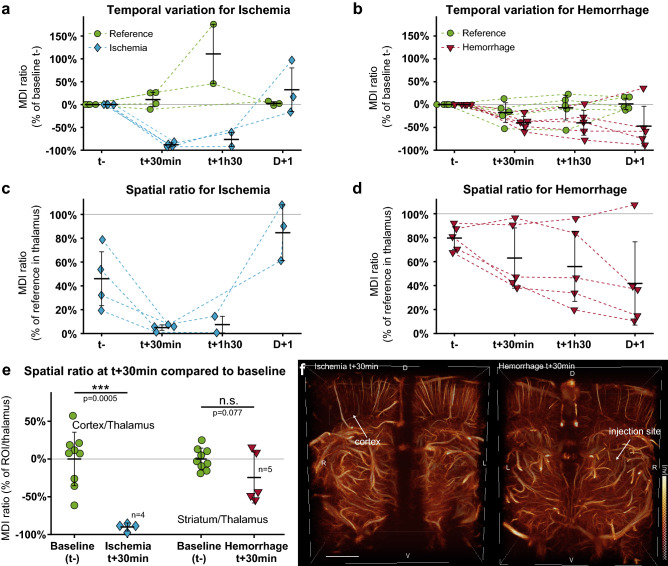
Comparison between ischemic and hemorrhagic models. Variation of the MDI normalized prior onset (t−) for each ROI in the ischemic (a) and hemorrhagic (b) stroke and reference ROIs. Ratios between the ischemic (c) and hemorrhagic (d) strokes ROI and the reference region. (e) Normalized MDI ratio of the lesion site and the reference region, compared to the baseline (t-). All animals were pooled for baseline ratio in cortex and striatum (n = 9). Student t-test with equal variance (f) Volume renderings of ischemic (left) and hemorrhagic (right) strokes 30 min after onset. Scale bar 2 mm. Figures were created with (a–e) MatLab 2019a (https://www.mathworks.com/products/matlab), (f) Amira 2019.4 (https://www.thermofisher.com/amira-avizo).

