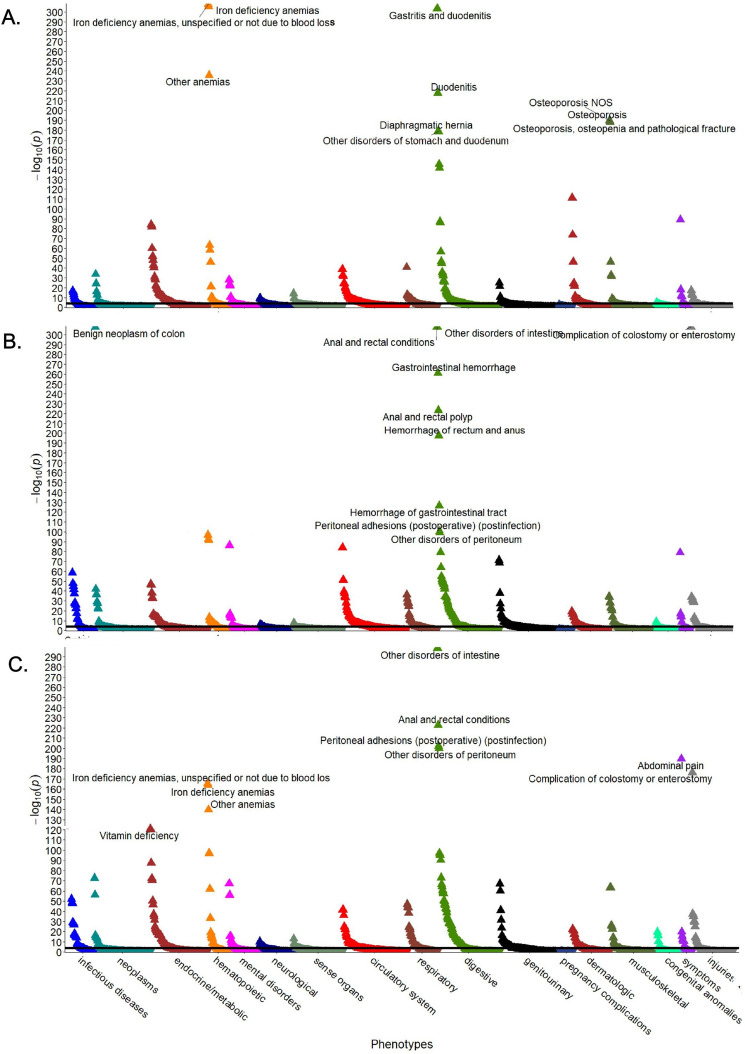
Figure 1.
Conditions associated with CeD and IBD. Manhattan plots display Phecodes that are significantly over/underrepresented in individuals with coeliac disease (A), ulcerative colitis (B), or Crohn´s disease (C) compared with the reference group without these diagnoses. The ten most significant associations are shown. Upwards/downwards pointing triangles refer to Phecodes that are over/underrepresented. The black line indicates the significance level after Bonferroni adjustment for multiple testing. All analyses were adjusted for sex, age, and body mass index, and p values are displayed in a − log10 format. NOS not otherwise specified.

