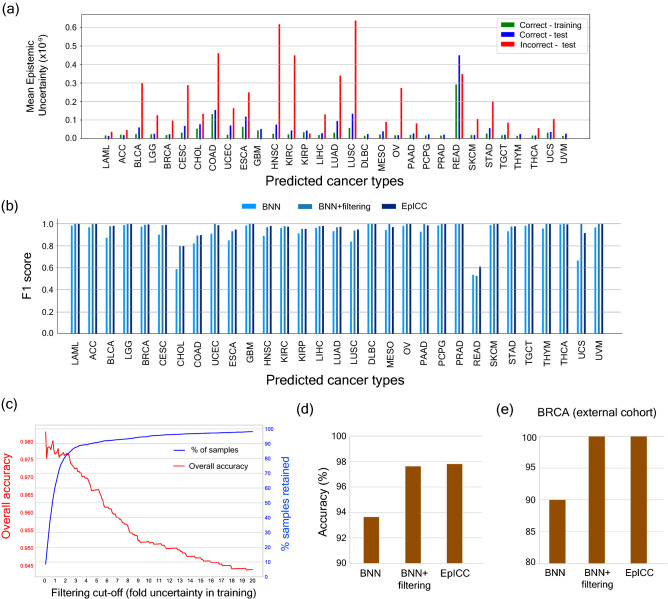
Figure 3.
Cancer classification accuracy improves with uncertainty correction. (a) Plots showing the comparison of uncertainty on the correct and incorrect predictions. The green-coloured bars represent the mean uncertainty of correct predictions on training data, the blue bars show the mean uncertainty of correct predictions on test data and the red bars show the mean uncertainty of incorrect predictions on the test data. (b) Comparison of F1 scores of the prediction made by BNN, after filtering the predictions based on mean training uncertainties of correct predictions and after applying uncertainty correction (EpICC). (c) Variation in overall accuracy and the percentage of samples retained for prediction using different values of filtering cut-off. (d) Comparison of overall classification accuracy of BNN, BNN with uncertainty filtering and EpICC for classification of cancer types. (e) Percentage accuracy of classification of BRCA from external cohort (ICGC) with BNN, BNN with uncertainty filtering by mean training correct predictions, and by EpICC.

