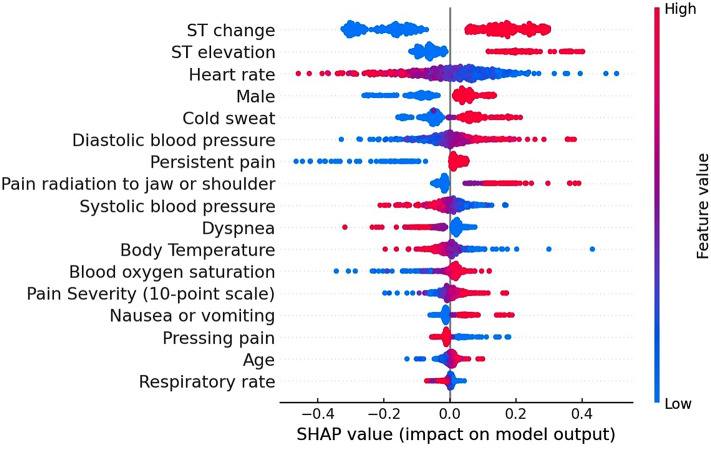
Figure 3.
SHAP values of the prehospital diagnostic algorithm for acute coronary syndrome using 17 features. The impact of the features on the model output was expressed as the SHAP value calculated with the support vector machine (radial basis function). The features are placed in descending order according to their importance. The association between the feature value and SHAP value indicates a positive or negative impact of the predictors. The extent of the value is depicted as red (high) or blue (low) plots. SHAP (SHapley Additive exPlanation).

