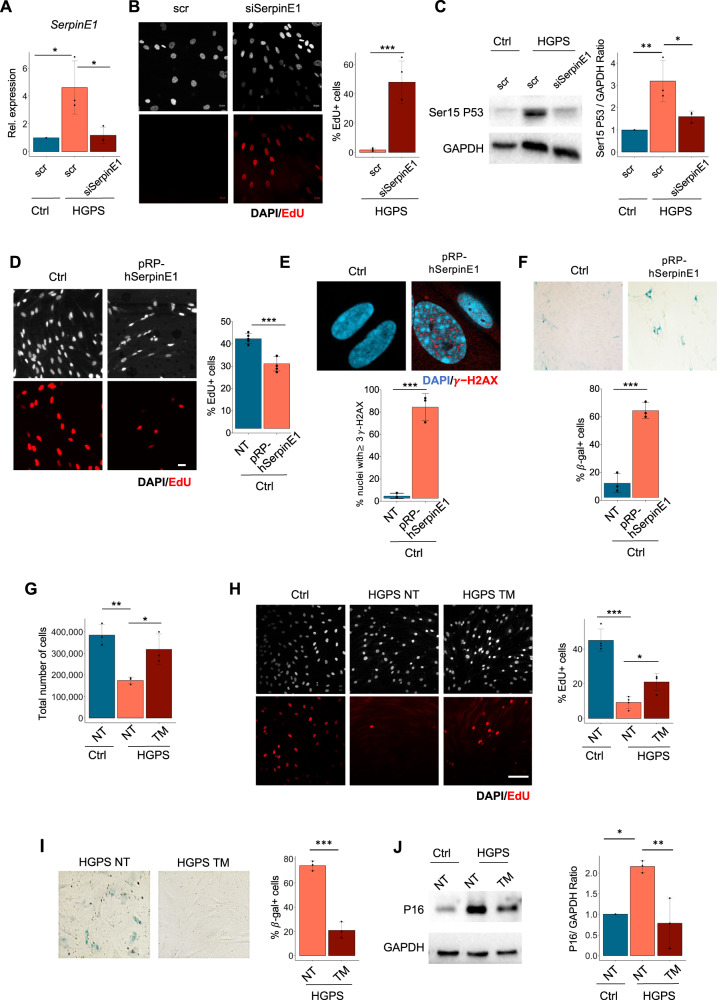
Fig. 2. SerpinE1/PAI-1 downregulation resumes proliferation and reduces DNA damage in HGPS.
A qRT-PCR for SerpinE1 transcript after 48 h upon transfection in control cells (Ctrl) and HGPS transfected with scramble (scr) or siRNA for SerpinE1 (siSerpinE1), (n = 3). B Representative images relative to 8YO HGPS fibroblasts transfected with scramble (scr) or siRNA for SerpinE1 (siSerpinE1) analyzed 5 days post transfection and exposed to a 16 h EdU pulse (red). Scale bar 20 μm. Quantification of the percentage EdU positive nuclei in 8YO HGPS fibroblasts transfected with scramble (scr) or siRNA for SerpinE1(siSerpinE1) analyzed 5 days post transfection and exposed to a 16 h EdU (n = 3). C Cropped immunoblot for p53 phosphorylated at Serine 15 (Ser15 P53) and GAPDH as loading control in 8YO HGPS fibroblasts transfected with scramble (scr) or siRNA for SerpinE1 (siSerpinE1) analyzed 5 days post transfection. Plot represents Ser15 P53/GAPDH ratio based on the average for each experimental point, (n = 3). D Representative images of healthy fibroblasts transfected four consecutive times every 3 days with a Ctrl vector pcDNA3 (Ctrl) and pRP[Exp]-CAG > hSERPINE1 (pRB-hSerpinE1) and exposed to a 6 h EdU pulse (red). Scale bar 20 μm. Quantification of the percentage of EdU positive nuclei in Ctrl and pRB-SerpinE1 fibroblasts exposed to a 6 h EdU pulse, (n = 4). E Representative images of immunofluorescence for γ-H2AX (red) and DAPI (blue) in healthy fibroblasts transfected four consecutive times every 3 days with a Ctrl vector pcDNA3 (Ctrl) and pRP[Exp]-CAG > hSERPINE1 (pRB-hSerpinE1). Scale bar 20 μM. Quantification of the percentage of nuclei in Ctrl and pRB-SerpinE1 fibroblasts with at least three γ-H2AX foci, (n = 3). F Beta-Gal staining in healthy fibroblasts transfected four consecutive times every 3 days with a Ctrl vector pcDNA3 (Ctrl) and pRP[Exp]-CAG > hSERPINE1 (pRB-hSerpinE1). Quantification of the percentage of beta-gal positive cells in Ctrl and pRB-SerpinE1 fibroblasts, (n = 3). G Plot representing the total cell number of 8YO HGPS fibroblasts untreated and treated with TM5441 (TM) for 10 days compared to the age-matched control (Ctrl). H Representative images relative to 8YO HGPS fibroblasts untreated and treated with TM5441 (TM) for 10 days and age-matched control (Ctrl) exposed to a 16 h EdU pulse (red). Scale bar 50 μm. Quantification of the percentage EdU positive nuclei in 8YO HGPS fibroblasts untreated and treated with TM5441 (TM) for 10 days and age-matched control (Ctrl) exposed to a 16 h EdU pulse, (n = 4). I Beta-Gal staining in 8YO HGPS fibroblasts untreated (NT) or treated with TM5441 (TM). Quantification of the percentage of beta-gal positive cells from 8YO HGPS fibroblasts untreated (HGPS NT) or treated with TM5441 (HGPS TM), (n = 3). J Cropped immunoblot for P16 and GAPDH in 8YO HGPS (HGPS) untreated and treated with TM5441(TM) and age-matched control (Ctrl) cells. Plot represents P16/GAPDH ratio based on the average for each experimental point, n = 3.

