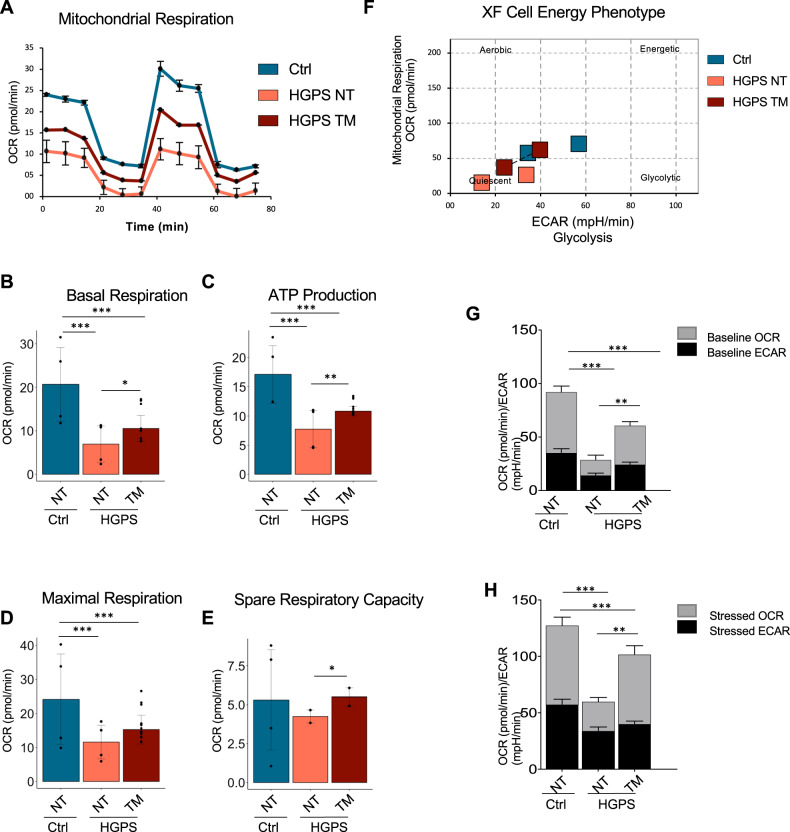
Fig. 5. TM5441 treatment improves energy metabolism of HGPS.
A Representative data graphic of oxygen consumption rate (OCR) obtained from the Cell Mito Stress Test. Mitochondrial respiration expressed as normalized OCR of control, HGPS and HGPS TM5441-treated cells after the sequential addition of oligomycin, FCCP, rotenone and antimycin as indicated. B The basal respiration which represents the oxygen consumption used to meet cellular ATP demand in resting condition. C Mitochondrial ATP production, calculated as the OCR difference between the baseline and after the addition of oligomycin. D The maximal respiration measured as the maximal oxygen consumption rate attained by adding the uncoupler FCCP. E The spare respiratory capacity obtained from the analysis of the Maximal respiration. F The cellular energy diagram showing the normalized oxygen consumption rate (OCR) and the normalized extracellular acidification rate (ECAR) of control, HGPS and HGPS TM5441-treated cells at baseline and stressed conditions. G, H Metabolic potential of control, HGPS and HGPS TM5441-treated fibroblasts was calculated from unstressed G and stressed (H) OCR/ECAR over baseline.

