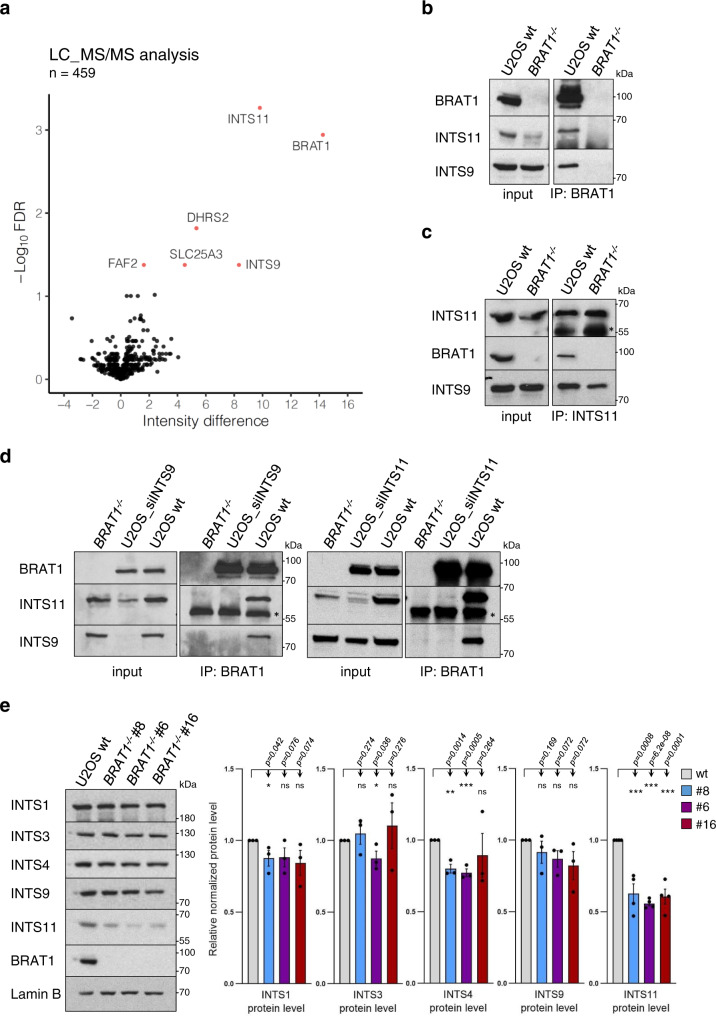
Fig. 1. BRAT1 interacts with the Integrator catalytic cleavage heterodimer.
a A volcano plot of proteins enriched in BRAT1 immunoprecipitates from U2OS cells. The –Log10 (Student’s t-test FDR) is plotted against the difference of mean intensities between wild-type and BRAT1−/− samples. Red dots indicate significantly enriched proteins (intensity difference >1; FDR < 0.05). b, c Levels of BRAT1, INTS11 and INTS9 in BRAT1 (b) and INTS11 (c) immunoprecipitates from wild-type (U2OS wt) and BRAT1-/- (clone #8) cells, measured by Western blotting. The black asterisk marks a nonspecific band. d Levels of BRAT1, INTS11 and INTS9 in BRAT1 immunoprecipitates from BRAT1−/− (clone #8), U2OS wt, and U2OS cells transiently transfected with siINTS9 or siINTS11 as indicated. The black asterisk marks a nonspecific band. b–d The experiment was performed three times with similar results. e Immunoblot of indicated proteins and quantification in U2OS wt and BRAT1−/− cells (clones #8, #6, and #16). Represented as the mean ± SD (n = 3 for INTS1, INTS3, INTS4 and INTS9; n = 4 for INTS11). Statistical significance was determined by a one-sided paired Student’s t-test (*p < 0.05, **p < 0.01, ***p < 0.001, ns not significant). Samples derived from the same experiment and blots were processed in parallel. Uncropped and unprocessed scans are provided in the Source Data file.

