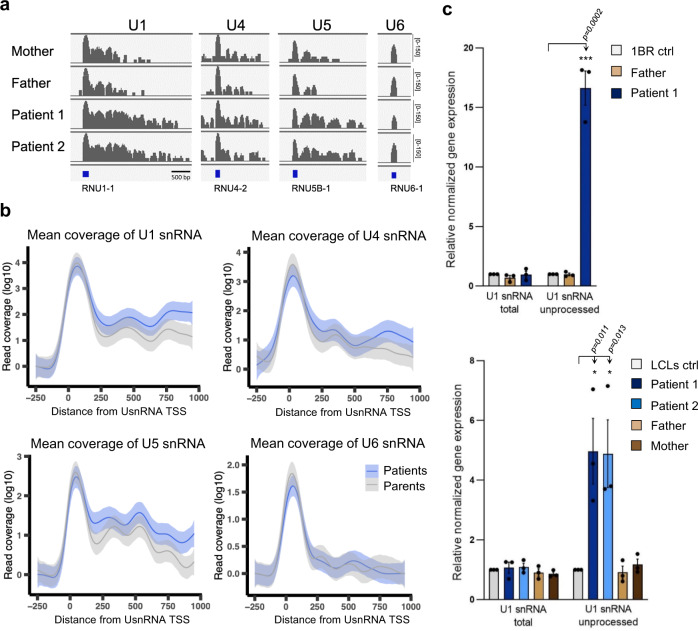
Fig. 6. Altered Integrator function in BRAT1-mutated patient cells.
a RNA-seq coverage plots for genes coding U1, U4, U5, or U6 snRNA in unaffected parents (Mother and Father) and BRAT1 patient-derived (Patient 1 and Patient 2) lymphoblastoid cell lines (LCLs) are shown, as indicated. b Metaplot analysis of mean reads coverage of individual U1, U4, U5, or U6 snRNA transcripts from unaffected parents (Mother and Father) and BRAT1 patient-derived (Patient 1 and Patient 2) LCLs. Data are presented as the smoothed mean coverage of the selected genes (n = 4) averaged across samples (n = 2) in the respective group with 95% confidence interval of the mean shown (ribbon). TSS transcription start site. c RT-qPCR analysis of total and unprocessed RNU1-1 transcripts in control, parent and BRAT1 patient-derived fibroblasts (top) and LCLs (bottom). Data are represented as the mean ± SD (n = 3). Statistical significance was determined by a one-sided paired Student’s t-test (*p < 0.05, ***p < 0.001).

