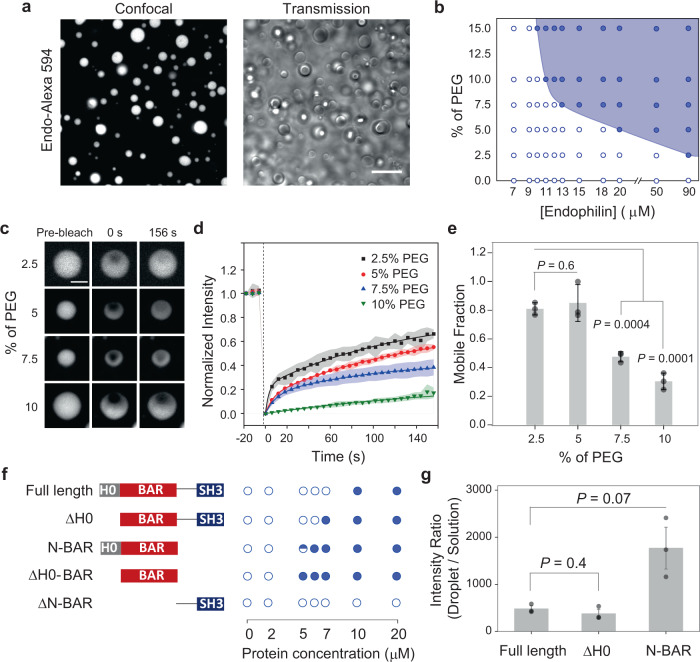
Fig. 1. Endophilin undergoes LLPS in a crowded environment.
a Droplets formed by rat endophilin A1 (25 µM) in the presence of 10% PEG. Left, confocal fluorescence image of LLPS droplets of endophilin doped with Alexa 594-labeled endophilin (1 µM); right, transmission image of the droplets. Scale bar 10 µm. b Phase diagram showing endophilin-PEG LLPS system. The filled circles indicate where liquid-like droplets were observed, whereas the open circles indicate no droplet formation. c Representative confocal images of endophilin droplets before, 0 s after, and 156 s after photobleaching at different PEG concentrations. Unlabeled endophilin concentrations used for droplet formation were 150, 50, 25, and 25 µM for 2.5, 5, 7.5, and 10% PEG, respectively, and Alexa 488-labeled endophilin (1 µM) was used for fluorescence imaging. Scale bar 2 µm. d FRAP time profiles to show the recovery rate at different PEG concentrations. Normalized intensities of the bleached area relative to the unbleached intensities are plotted for each time point. Each data point is an average of three repeats performed on different droplets, error bars indicate standard deviation. The solid lines indicate 2-exponential (2.5%, 5%, and 7.5% PEG) or 1-exponential (10% PEG) fits of the recovery profiles. e Bar plot showing the mobile fractions of protein within the droplets obtained from the exponential fits of the recovery profiles. Error bars indicate standard deviations of three independent FRAP profiles. f Domain structures of full-length endophilin, its ΔH0 mutant, N-BAR only mutant, ΔH0-BAR domain mutant, and ΔN-BAR mutant and their phase behavior in the presence of 10% PEG. The open circles and the filled circles indicate observation of no droplet and droplets in 3 out of 3 trials respectively using different preparations whereas the half-filled circle indicates droplets were observed 2 out of 3 trials. g Fluorescence intensity ratio of Alexa 594-labeled endophilin variants (1 µM) from corresponding protein droplets vs. from the bulk solution. The droplets were formed in the presence of 25 µM of the unlabeled protein-variant and 10% PEG. The bar plots represent mean ± standard error of mean (s.e.m.) from three independent experiments (gray circles) where 10–20 droplets were considered per experiment. All P values (two-tailed) were determined by Student’s t test, N = 3.

