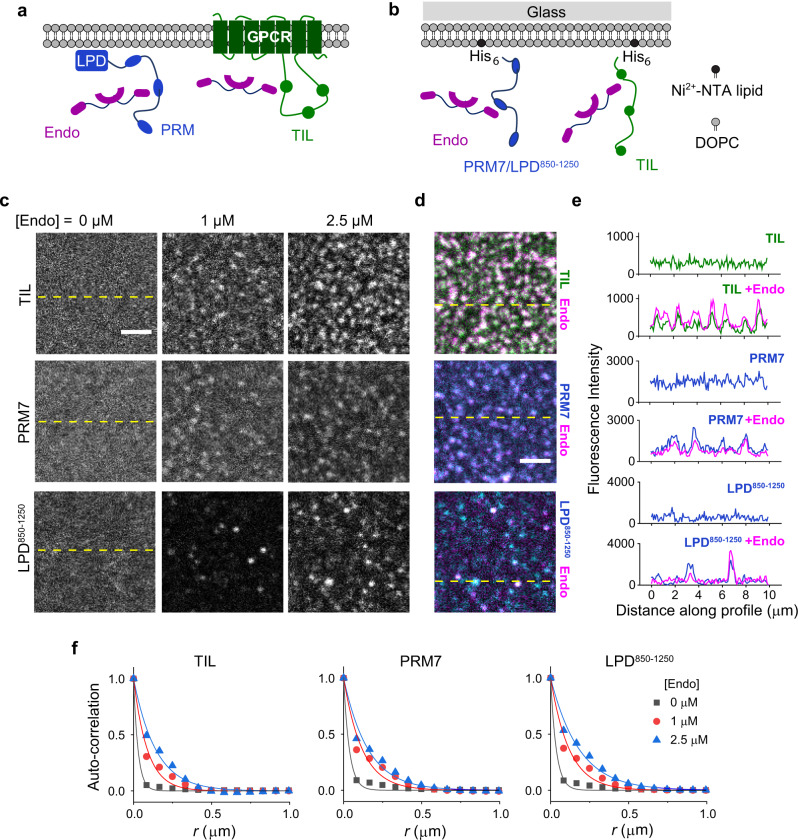
Fig. 4. Endophilin forms clusters on the membrane in the presence of multivalent binding partners.
a Cartoon representation of the interactions between endophilin and proline-rich-motifs of GPCR-TIL and LPD C-terminal domain on cell membrane. b An in vitro model system that has been developed to mimic the endophilin–LPD–GPCR interactions using solid-supported bilayers (SSBs) with conjugated either PRM7-His6 or LPD850–1250-His6 and TIL-His6 via Ni2+-NTA-lipids (right). c Confocal images showing distributions of TIL-Alexa 488 (top), PRM7-Alexa 633 (middle), and LPD850–1250-Alexa 647 (bottom) on SSBs composed of Ni2+-NTA lipid and DOPC (1:99). Images were recorded after incubating the functionalized SSBs with 0, 1, and 2.5 µM endophilin for 30 min. Scale bar 2.5 µm. d Merged images of endophilin-Alexa 594 channel with TIL-Alexa 488 channel (top), PRM7-Alexa 633 channel (middle), and LPD850–1250-Alexa 647 channel (bottom) in the presence of 2.5 µM endophilin. Scale bar 2.5 µm. e Intensity profiles along the dashed yellow lines shown in c, d showing that clustering of TIL, PRM7, and LPD850–1250 occurred in the presence of endophilin and endophilin itself colocalized with TIL, PRM7, and LPD850–1250 in the clusters. f Radially averaged normalized autocorrelation function (G(r)) demonstrating the degrees of clustering in the TIL (left), PRM7 (middle), and LPD850–1250 (right) channels at 0–2.5 µM of endophilin. The auto-correlation function determines the probability of finding a fluorescent pixel at a given distance r from a center pixel. Solid lines represent the fitting of the auto-correlation plots to a single-exponential function, G(r) = A e−r/R, to express the extent of clustering in terms of a correlation length (R). All experiments were performed in 20 mM HEPES buffer, 150 mM NaCl, 1 mM TCEP, pH 7.4, and at room temperature.

