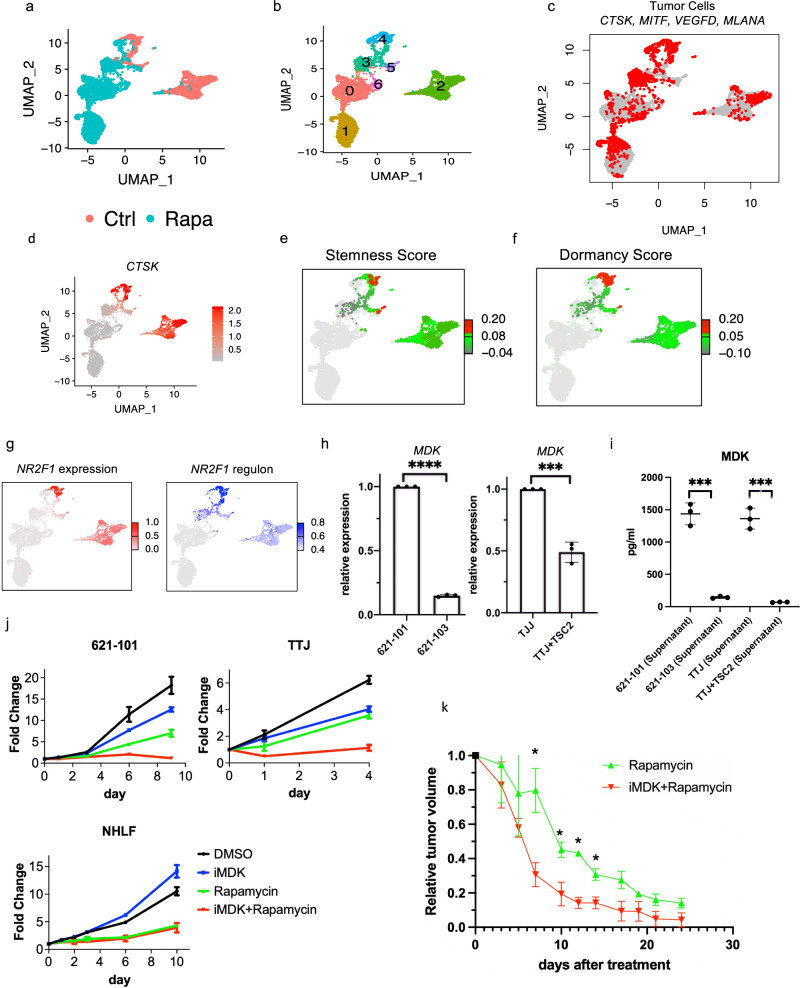
Fig. 3. The stem-like population of AML cells may contribute to rapamycin resistance.
a UMAP plot of primary cultures derived from AML tumor colored by treatment. Cells were treated with DMSO as control (red) or 20 nM rapamycin (cyan) for 24 hours before scRNA-Seq. b UMAP plot of the AML-derived primary cell culture, colored by clusters. c Expression of 5 AML markers in the primary AML culture before and after rapamycin treatment (as in A). d CTSK expression in cells before and after rapamycin (as in A). e Cluster 4 in the DMSO control group showed high stemness score, calculated using a panel of 50 cancer stem cell marker genes (see method). Note that stemness score was only calculated in DMSO control group, and the cells in rapamycin treatment group are colored in gray. f Cluster 4 in the DMSO control group showed high dormancy score, calculated using known dormancy marker genes (see method). Note that dormancy score was only calculated in DMSO control group, and the cells in rapamycin treatment group are colored in gray. g Expression (left) and regulon activity (right) of NR2F1 in control group. Note: only cluster 2 and cluster 4 were comparatively analyzed for regulon activity. The color bars indicate expression level and regulon activity only for these two clusters; other cells are colored in gray. h Relative expresion of MDK in TSC2-deficient cell lines compared to TSC2-add back cells. Left panel: patient-derived TSC2-deficent 621-101 cells (n = 3) compared to TSC2-add back 621-103 cells (n = 3); right panel: mouse kidney derived TSC2-deficent TTJ cells (n = 3) compared to TSC2-add back cells (n = 3). Data are presented as mean ± SD. ***p value = 0.0004; ****p value < 0.0001, two-sided t test. i MDK protein level in the cell culture supernatants (n = 3 per cell line) measured by ELISA. Data are presented as mean ± SD. ***p < 0.001, two-sided t test. j Proliferation measured by crystal violet assay. Treatments were: DMSO, 1 µM iMDK, 20 nM rapamycin, and combination of iMDK and rapamycin for days indicated. All experiments were replicated three times. 621-101 and TTJ are TSC-deficient. NHLF: normal human lung fibroblasts. Data are presented as mean ± SD. k Tumor size reduction relative to pre-treatment tumor volume in rapmayin treatment and combined iMDK and rapamycin treatment groups. p values were calculated by two-sided t test. *p < 0.05. Data are presented as mean ± SD. Day 7: p value = 0.001; day 10: p value = 0.001; day 12: p value = 0.001; day 14: p value = 0.001. Relative tumor size after treatment for all treatment groups can be found in Supplementary Fig. 6d: TTJ xenograft mice (n = 6 per group) were treated three times/wk with DMSO, iMDK (9 mg/kg), rapamycin (3 mg/kg), or combined iMDK (9 mg/kg) and rapamycin (3 mg/kg). Averaged tumor size was reduced to <20% of pre-treatment volume after 4 treatments in the combination treatment group, in contrast to 8 treatments in the rapmaycin treatment group.

