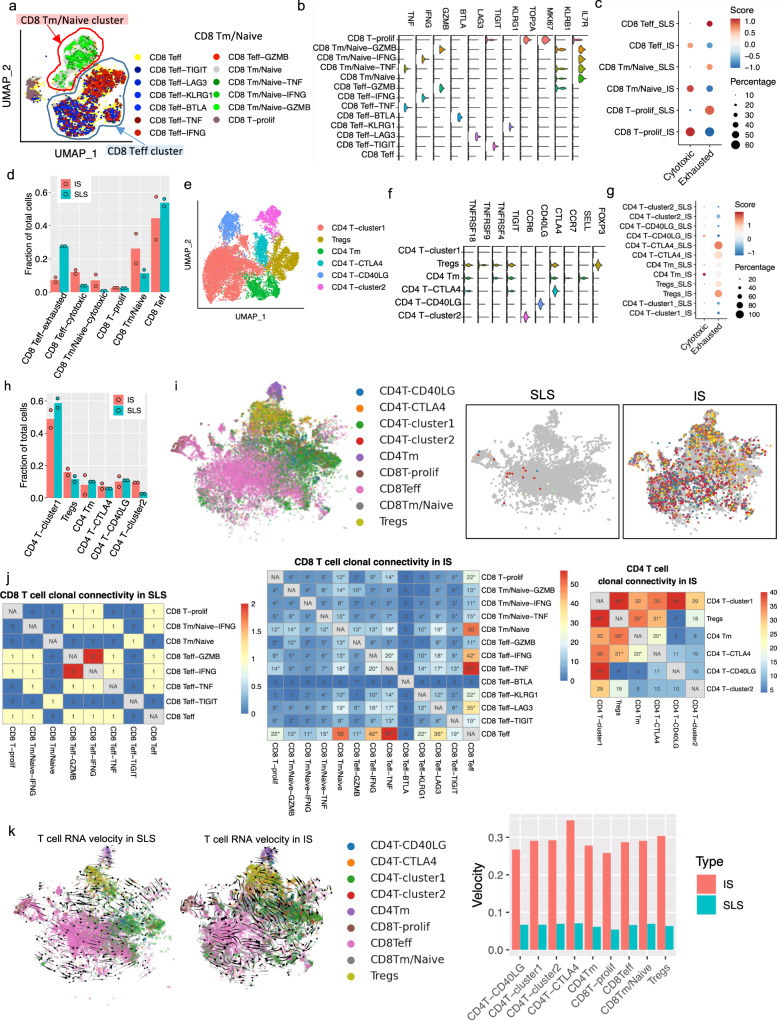
Fig. 5. T-cell dysfunction and suppressed T-cell clonal expansion in SLS-dominant tumors.
a UMAP plot of CD8+ T cells obtained from four AML tumors (downsampled to have equal number of cells from SLS or IS-dominant tumors). Phenotypic clusters are represented in distinct colors. CD8 Teff: effector CD8+ T cells; CD8 Tm/Naive: memory/naive CD8+ T cells; CD8 T-prolif: proliferating CD8+ T cells. b Violin plot of representative marker genes of each cluster of CD8+ T cells defined in a. The y axis represents the normalized gene expression values. c Module score of T-cell exhaustion or cytotoxicity across major CD8+ T cell population in SLS or IS-dominant tumors. Exhaustion module score was calculated based on relative expression of checkpoint genes TIGIT, LAG3, BTLA, and KLRG1. Cytotoxicity module score was calculated based on relative expression of cytotoxic effector genes GZMB, IFNG, and TNF. Module scores were scaled with red color representing higher score. Percentage of cytotoxic or exhausted cells in each population is represented by the circle size. d Quantification of fractional presentation of clusters of CD8+ T cells across two subtypes of tumors (n = 2 per subtype). e UMAP of clusters of CD4+ T cells obtained from four AML tumors (downsampled to have equal number of cells from SLS or IS-dominant tumors). f Violin plot of representative marker genes of each cluster of CD4+ T cells. The y axis represents the normalized gene expression value. g Module score of T-cell exhaustion or cytotoxicity across major CD4+ T cell population in SLS or IS-dominant tumors calculated as C. h Quantification of fractional presentation of clusters of CD4+ T cells across the two subtypes of tumors (n = 2 per subtype). i Representative shared T-cell clonotypes identified in IS-dominant tumor and in SLS-dominant tumor. Each clonotype is represented by a different color. Major cell groups are display on left panel. j Shared TCR clonotypes in CD8+ T cells and CD4+ T cells, after normalizing to total cell numbers. Number of shared clonotypes between each pair of subtypes were displayed. *p < 0.05, two-sided Fisher’s exact test. No shared clonotypes were identified in CD4+ T cells in SLS-dominant tumor. k RNA velocity of T-cell population calculated based on ratio of unspliced and spliced transcripts in each cell. (Left panel) velocity vectors represented by arrows indicate potential differentiation paths; (right panel) Quantitative analysis of RNA velocity of subtypes of T cells derived from IS (red) versus SLS (cyan) tumors.

