. 2019 Oct 25;1(12):4853–4862. doi: 10.1039/c9na00021f

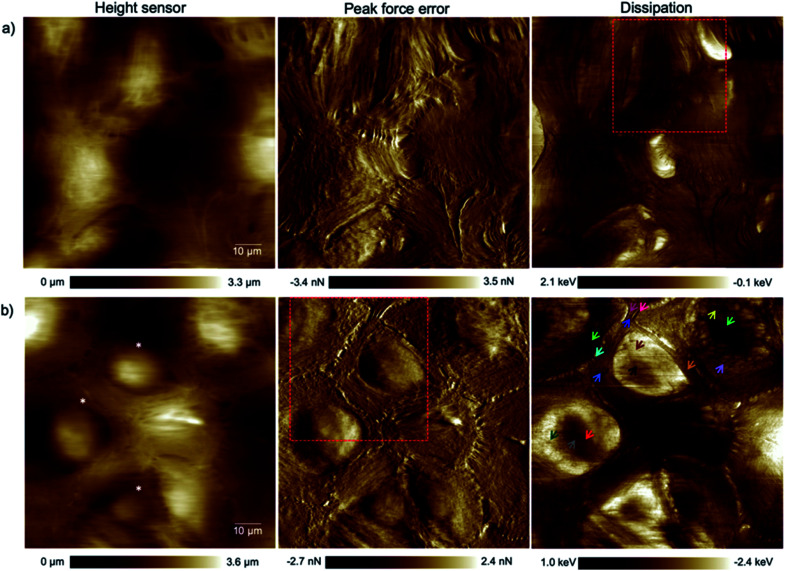
Fig. 1. High resolution (1024 pixels × 1024 pixels) topography, force error and dissipation maps of (a) healthy mammary and (b) invasive ductal carcinoma cells at the 1st passage of our culturing process and 24 hours after transferring them onto plasma treated coverslips obtained in a CO2-independent growth medium by PFT-AFM. A setpoint force of 150 pN, an oscillation amplitude of 300 nm and a driving frequency of 0.25 kHz were used for imaging both types of cells. The colored arrows refer to locations where force vs. indentation curves were obtained. The asterisks mark cells that have been used for cell size and shape analysis (cf. the ESI, Table S1).

Fig. 1