
Figure 3.
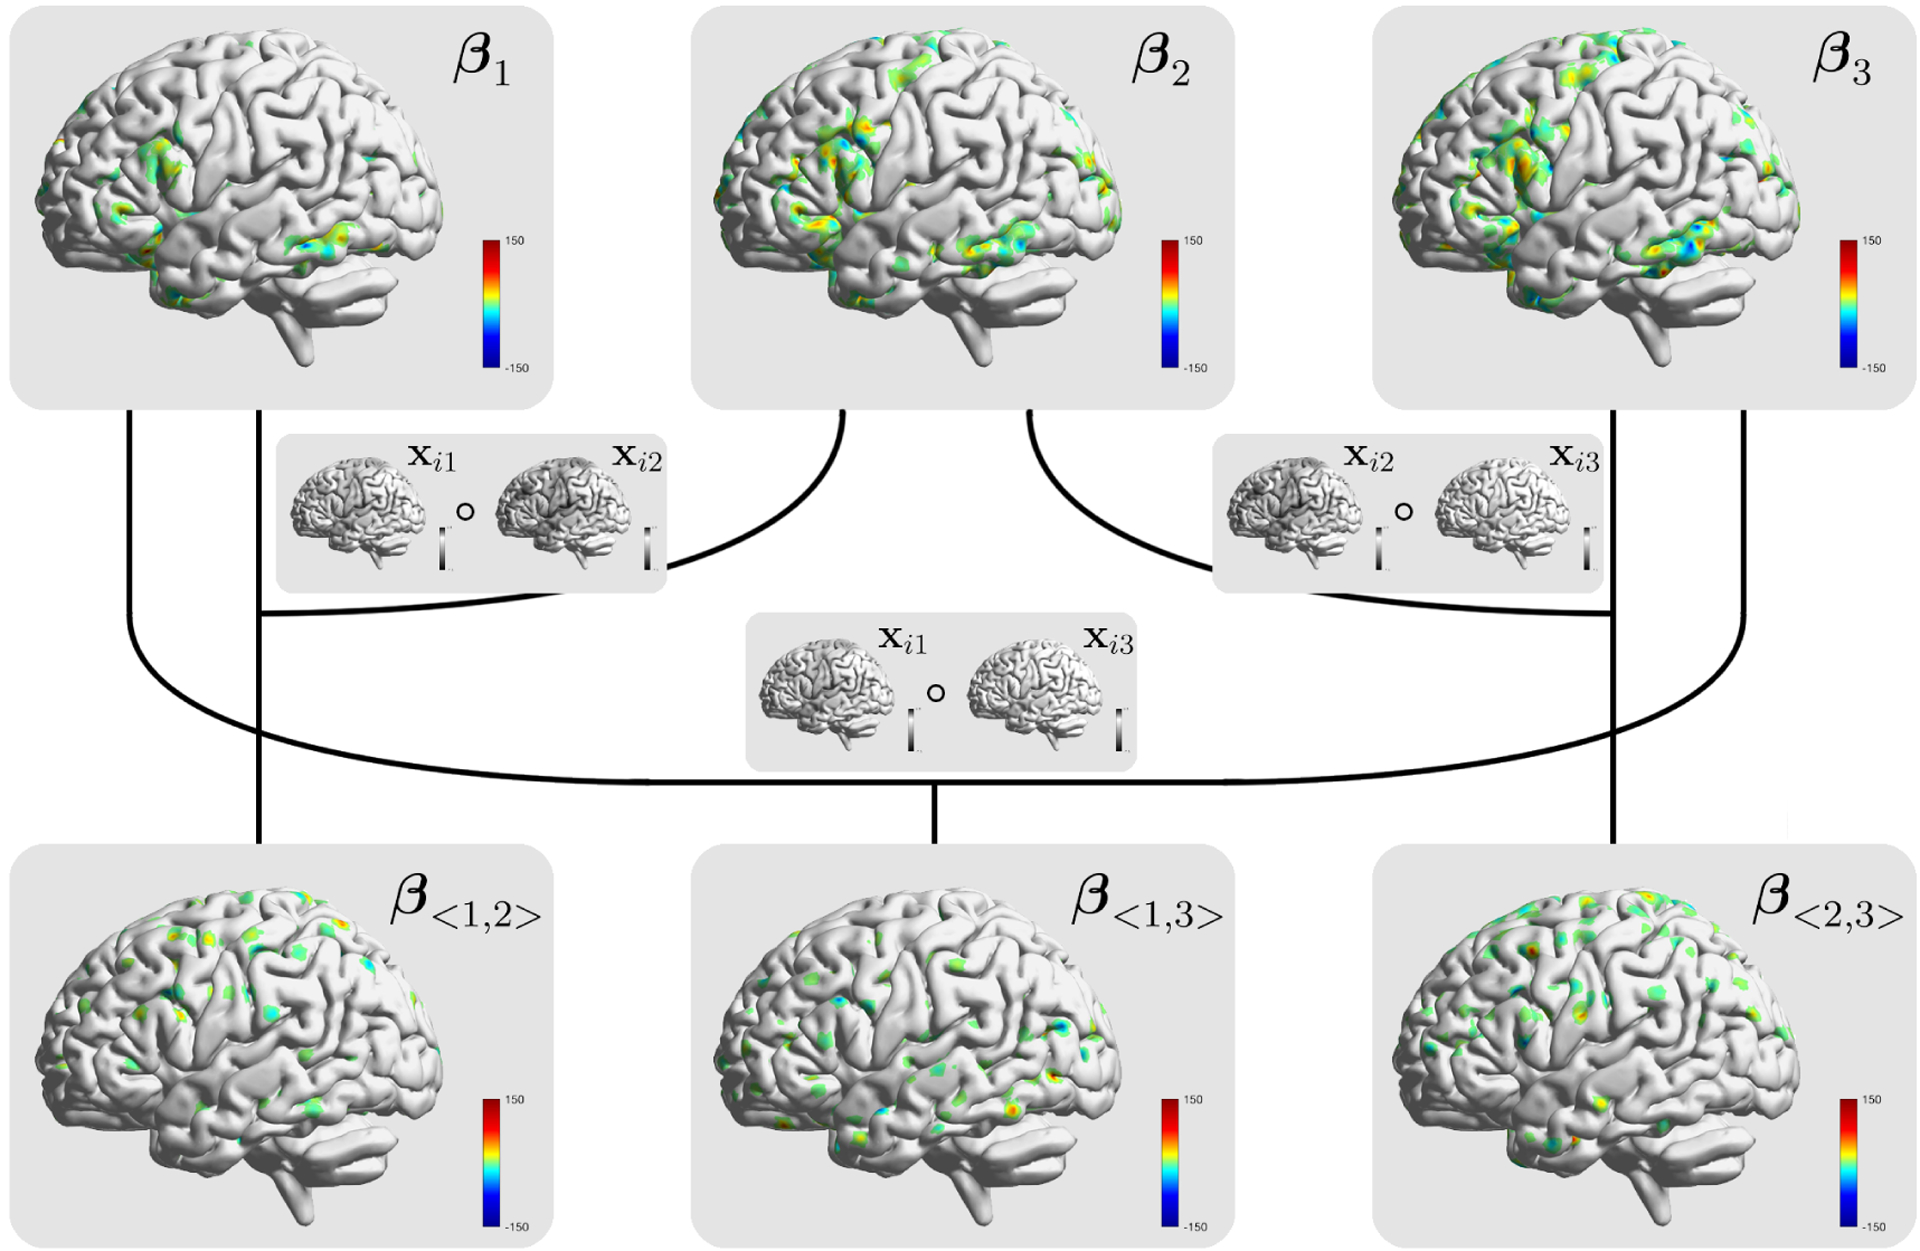
A demonstration of the model structure for BSSS with Xi, i = 1, 2, 3 representing the imaging markers associated with the 2back-0back, 2back-baseline, and 0back-baseline modalities from the ABCD study. Based on the results from the posterior inference, the identified main and interaction effects are displayed by the corresponding heat maps from the coefficients.