. 2020 Jun 29;2(8):3431–3443. doi: 10.1039/d0na00427h

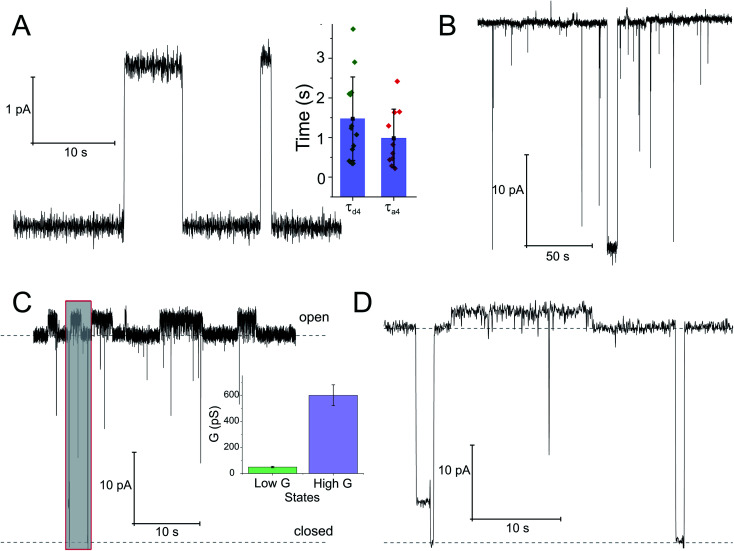
Fig. 4. Opening of the SecYEG translocon upon SecA binding. Two distinct conductivity states of the SecYEG–SecA complex are observed. (A) Short living low conductivity states are characterized by an amplitude of 2.5 pA. Inset: kinetics of the SecA-induced SecY opening was estimated from the duration of the closed states (τa4), dissociation kinetics was obtained from the open channel lifetime (τd4). (B) A longer living high conductivity state with an amplitude of ∼30 pA. (C) Record of the simultaneous activity of both channel types. It illustrates amplitude and lifetime differences between the large predominantly open channels and the smaller channels with a lifetime of a few seconds. Inset: bar chart of conductivities. The concentration of SecA in the hypertonic compartment was 2.1 μM. The transmembrane potential amounted to 50 mV. (D) Display of the grey fragment of the record in (C) at an extended time scale. The lower dashed line corresponds to the level of background current where the channels are closed. The upper dashed line visualizes the level of current through a single fully open channel.

Fig. 4