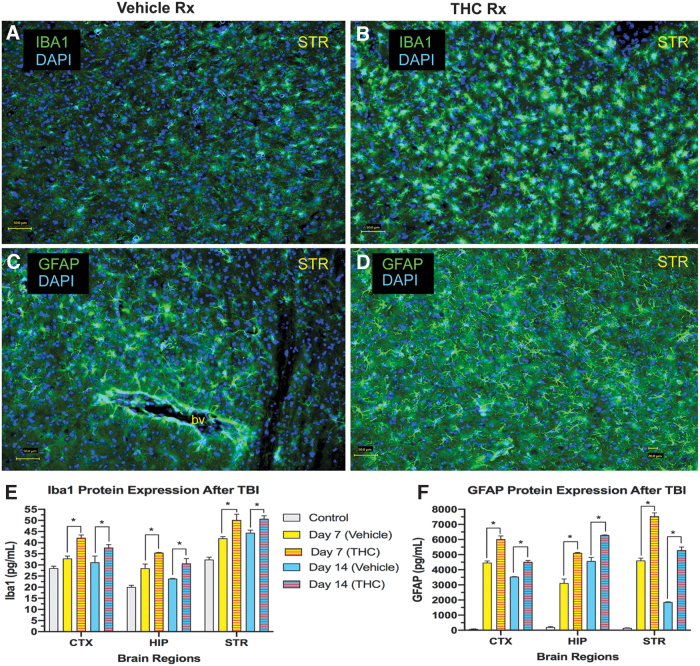
FIG. 3.
Microgliosis and astrocytosis following CCI. (A) Example of striatal microgliosis in vehicle-treated mouse on day 7. (B) Microgliosis is increased in the THC-treated mouse. Scale bar in lower left=50 M. (C) Astrocytes in striatum in untreated control mouse. (D) Astrocytosis is increased in striatum in THC-treated mouse (day 7). Scale bar=50 M. (E) Summary of Iba1 protein expression in 3 brain regions at day 7 and 14 (CTX; HIP; STR; two-way ANOVA shows that treatment but not time contributed to most of the total variance in each brain region; p<0.05). (F) Summary of GFAP protein expression in 3 brain regions at day 7 and 14 (two-way ANOVA revealed that both treatment and time contributed significantly to total variance in each brain region; p<0.05). Sidak's correction for multiple comparisons revealed that THC treatment compared with vehicle treatment increased expression of both Iba1 and GFAP in all 3 brain regions on day 7 and 14 (*p<0.05). CTX, cortex; DAPI, nuclear stain; GFAP, astrocytic cell marker; HIP, hippocampus; Iba1, marker of microglial cells; STR, striatum.

