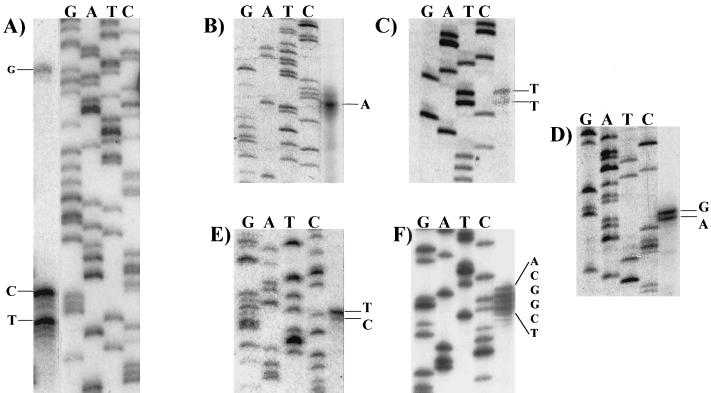
FIG. 3.
S1 nuclease mapping of the 5′ endpoints of ery cluster transcripts. The nucleotide(s) at the side of each panel indicate the likely transcription start site(s). (A) eryBIV; (B) eryAI; (C) eryBI; (D) eryBIII; (E) eryBVI; (F) eryK. The same primer was used to generate the sequence ladder and the 32P-labeled probe for S1 assays. For clarity, similar-intensity images of the S1 and sequence ladder lanes from the same gel were juxtaposed.

