. 2021 Mar 5;3(9):2529–2537. doi: 10.1039/d0na01024c

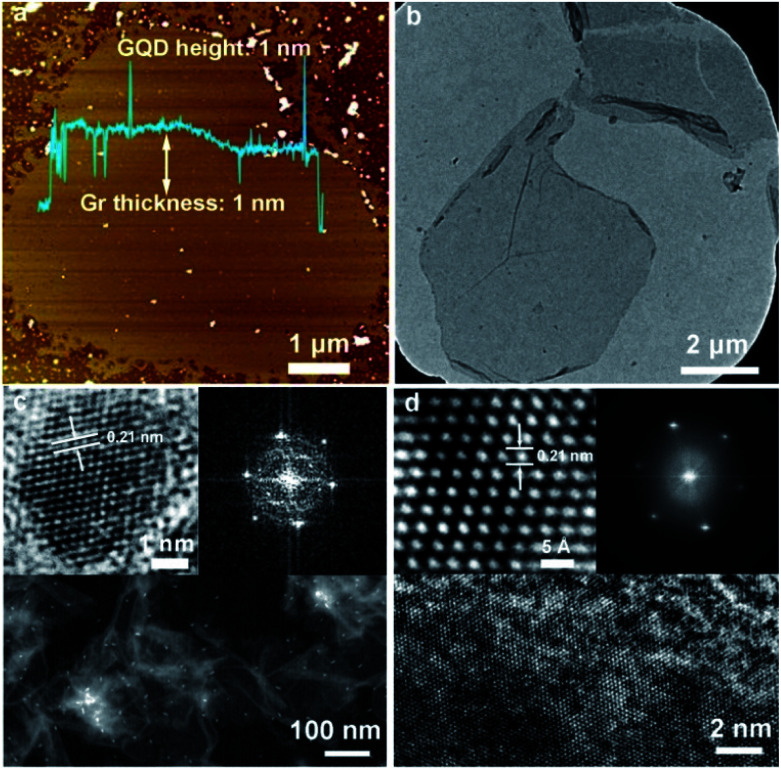
Fig. 1. (a) The AFM image of graphene sheets and GQDs derived from black liquor, showing the consistent refusion from the GQDs to the porous graphene sheet and then converted into GQDs/Gr. (b) TEM images of GQDs/Gr. (c) Top: the enlarged high-resolved HR-TEM image towards the GQDs lattice (left) and the FFT pattern (right). Bottom: the HAADF-STEM image of GQDs/Gr. (d) Top: the atomic resolved HR-TEM image of the graphene lattice (left) and the FFT pattern (right) to show the well-ordered honeycomb lattice structure with a lattice spacing of 0.21 nm. Bottom: the magnified HR-TEM images indicated a large area well-ordered graphene lattice.

Fig. 1