. 2021 Dec 31;4(3):952–966. doi: 10.1039/d1na00838b

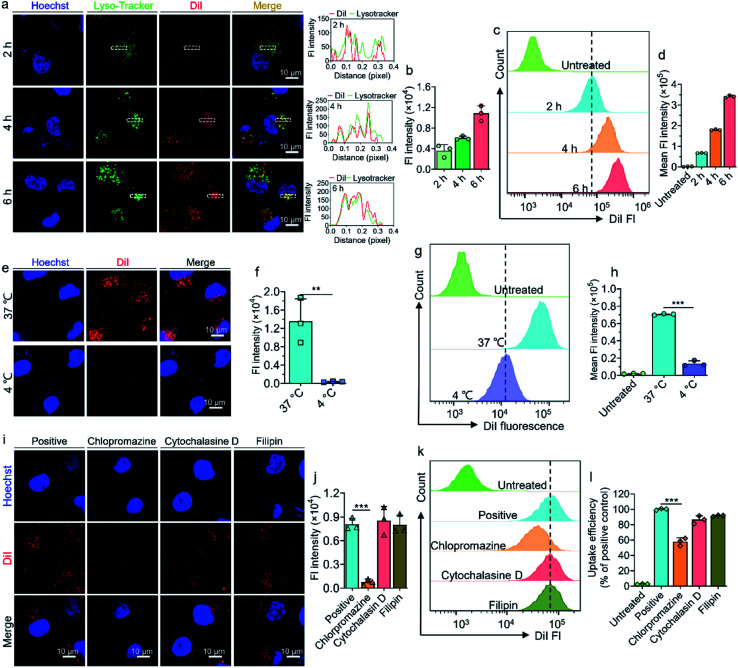
Fig. 4. Transcytotic uptake and uptake mechanism of liposomes in A549 cells. (a) Confocal laser scanning microscopy (CLSM) images of the cellular uptake of DiI-loaded liposomes in A549 cells. Cells were treated with liposomes for 2, 4 and 6 h before visualization by CLSM. The cell nuclei and lysosomes were stained with Hoechst 33342 (blue) and LysoTracker Green NDN-26 (green) before observation. The curves in the right panel represent the fluorescence intensities of DiI (red) and LysoTracker Green NDN-26 (green). (b) Quantification of the average DiI fluorescence intensity observed by CLSM in A549 cells. (c) Flow cytometry (FCM) analysis of cellular uptake of DiI-loaded liposomes by A549 cells and quantification of fluorescence intensity (d). CLSM observation (e) and quantification (f) of cellular uptake of liposomes upon 2 h of incubation with liposomes at 4 °C or 37 °C. FCM analysis (g) and quantification (h) of cellular uptake of DiI/SN38@LP at 4 °C or 37 °C. CLSM images (i) and quantification (j) of cellular uptake of liposomes when the cells were preincubated with inhibitors including chlorpromazine, cytochalasin D and filipin for 1 h. FCM data (k) and quantification (l) of cellular internalization of DiI-loaded liposomes upon preincubation with three endocytosis inhibitors. Fl: fluorescence.

Fig. 4