. 2019 May 17;1(7):2571–2579. doi: 10.1039/c9na00140a

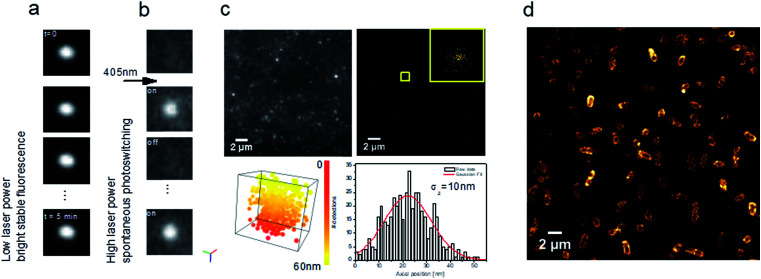
Fig. 8. Carbon dots as multi-tasking tools for single-molecule localization microscopy. (a) Representative images of a time series showing a stable bright fluorescence or (b) UV-induced blinking under continuous excitation at 639 nm; (c) TIRF image extracted from a time series (see ESI Video SI-1) showing blinking of CD solution (left) and reconstructed image of xy localization (right). Inset shows xy dispersion for a single CD showing a standard deviation σx,y = 10 nm (bottom, left, Video SI-2). 3D visualization of xyz localization (box size: x, y, z = 55 nm) (bottom, right). Axial localization distribution for a single CD. σz represents the standard deviation of the axial distribution. Colour bar corresponds to the axial position from 0 to 55 nm; (d) fluorescence nanoscopy image of E. coli incubated with CDs.

Fig. 8