. 2019 Aug 21;1(10):3980–3991. doi: 10.1039/c9na00289h

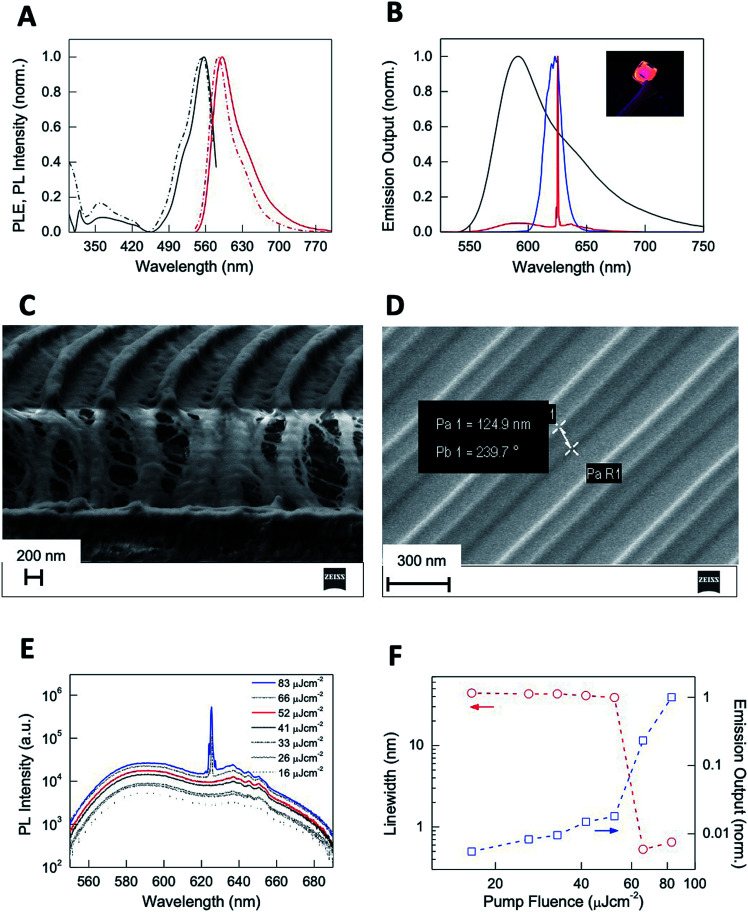
Fig. 7. (A) Normalized photoluminescence excitation PLE (black) and photoluminescence (PL) (red) spectra of CTPR–Rh6G protein solutions (dashed) and films (solid). (B) Normalized PL (black) and ASE (blue) spectra of CTPR–Rh6G protein films and laser emission (red) from nanostructured CTPR–Rh6G protein films. The inset shows the picture of a CTPR–Rh6G film under UV illumination. (C) Vertical cut SEM image of nanostructured CTPR–Rh6G on top of IPS with 416 nm periodicity. (D) SEM image of an IPS template showing lines of 125 nm height and 416 nm period. (E) log–lin plot of the PL spectra as a function of excitation fluence. (F) log–log plot of the PL linewidth (circles, left Y-axis) and emission output normalized by the output at the highest fluence (squares, right Y-axis) as a function of excitation fluence (red and blue arrows indicate, respectively, their corresponding Y axis).

Fig. 7