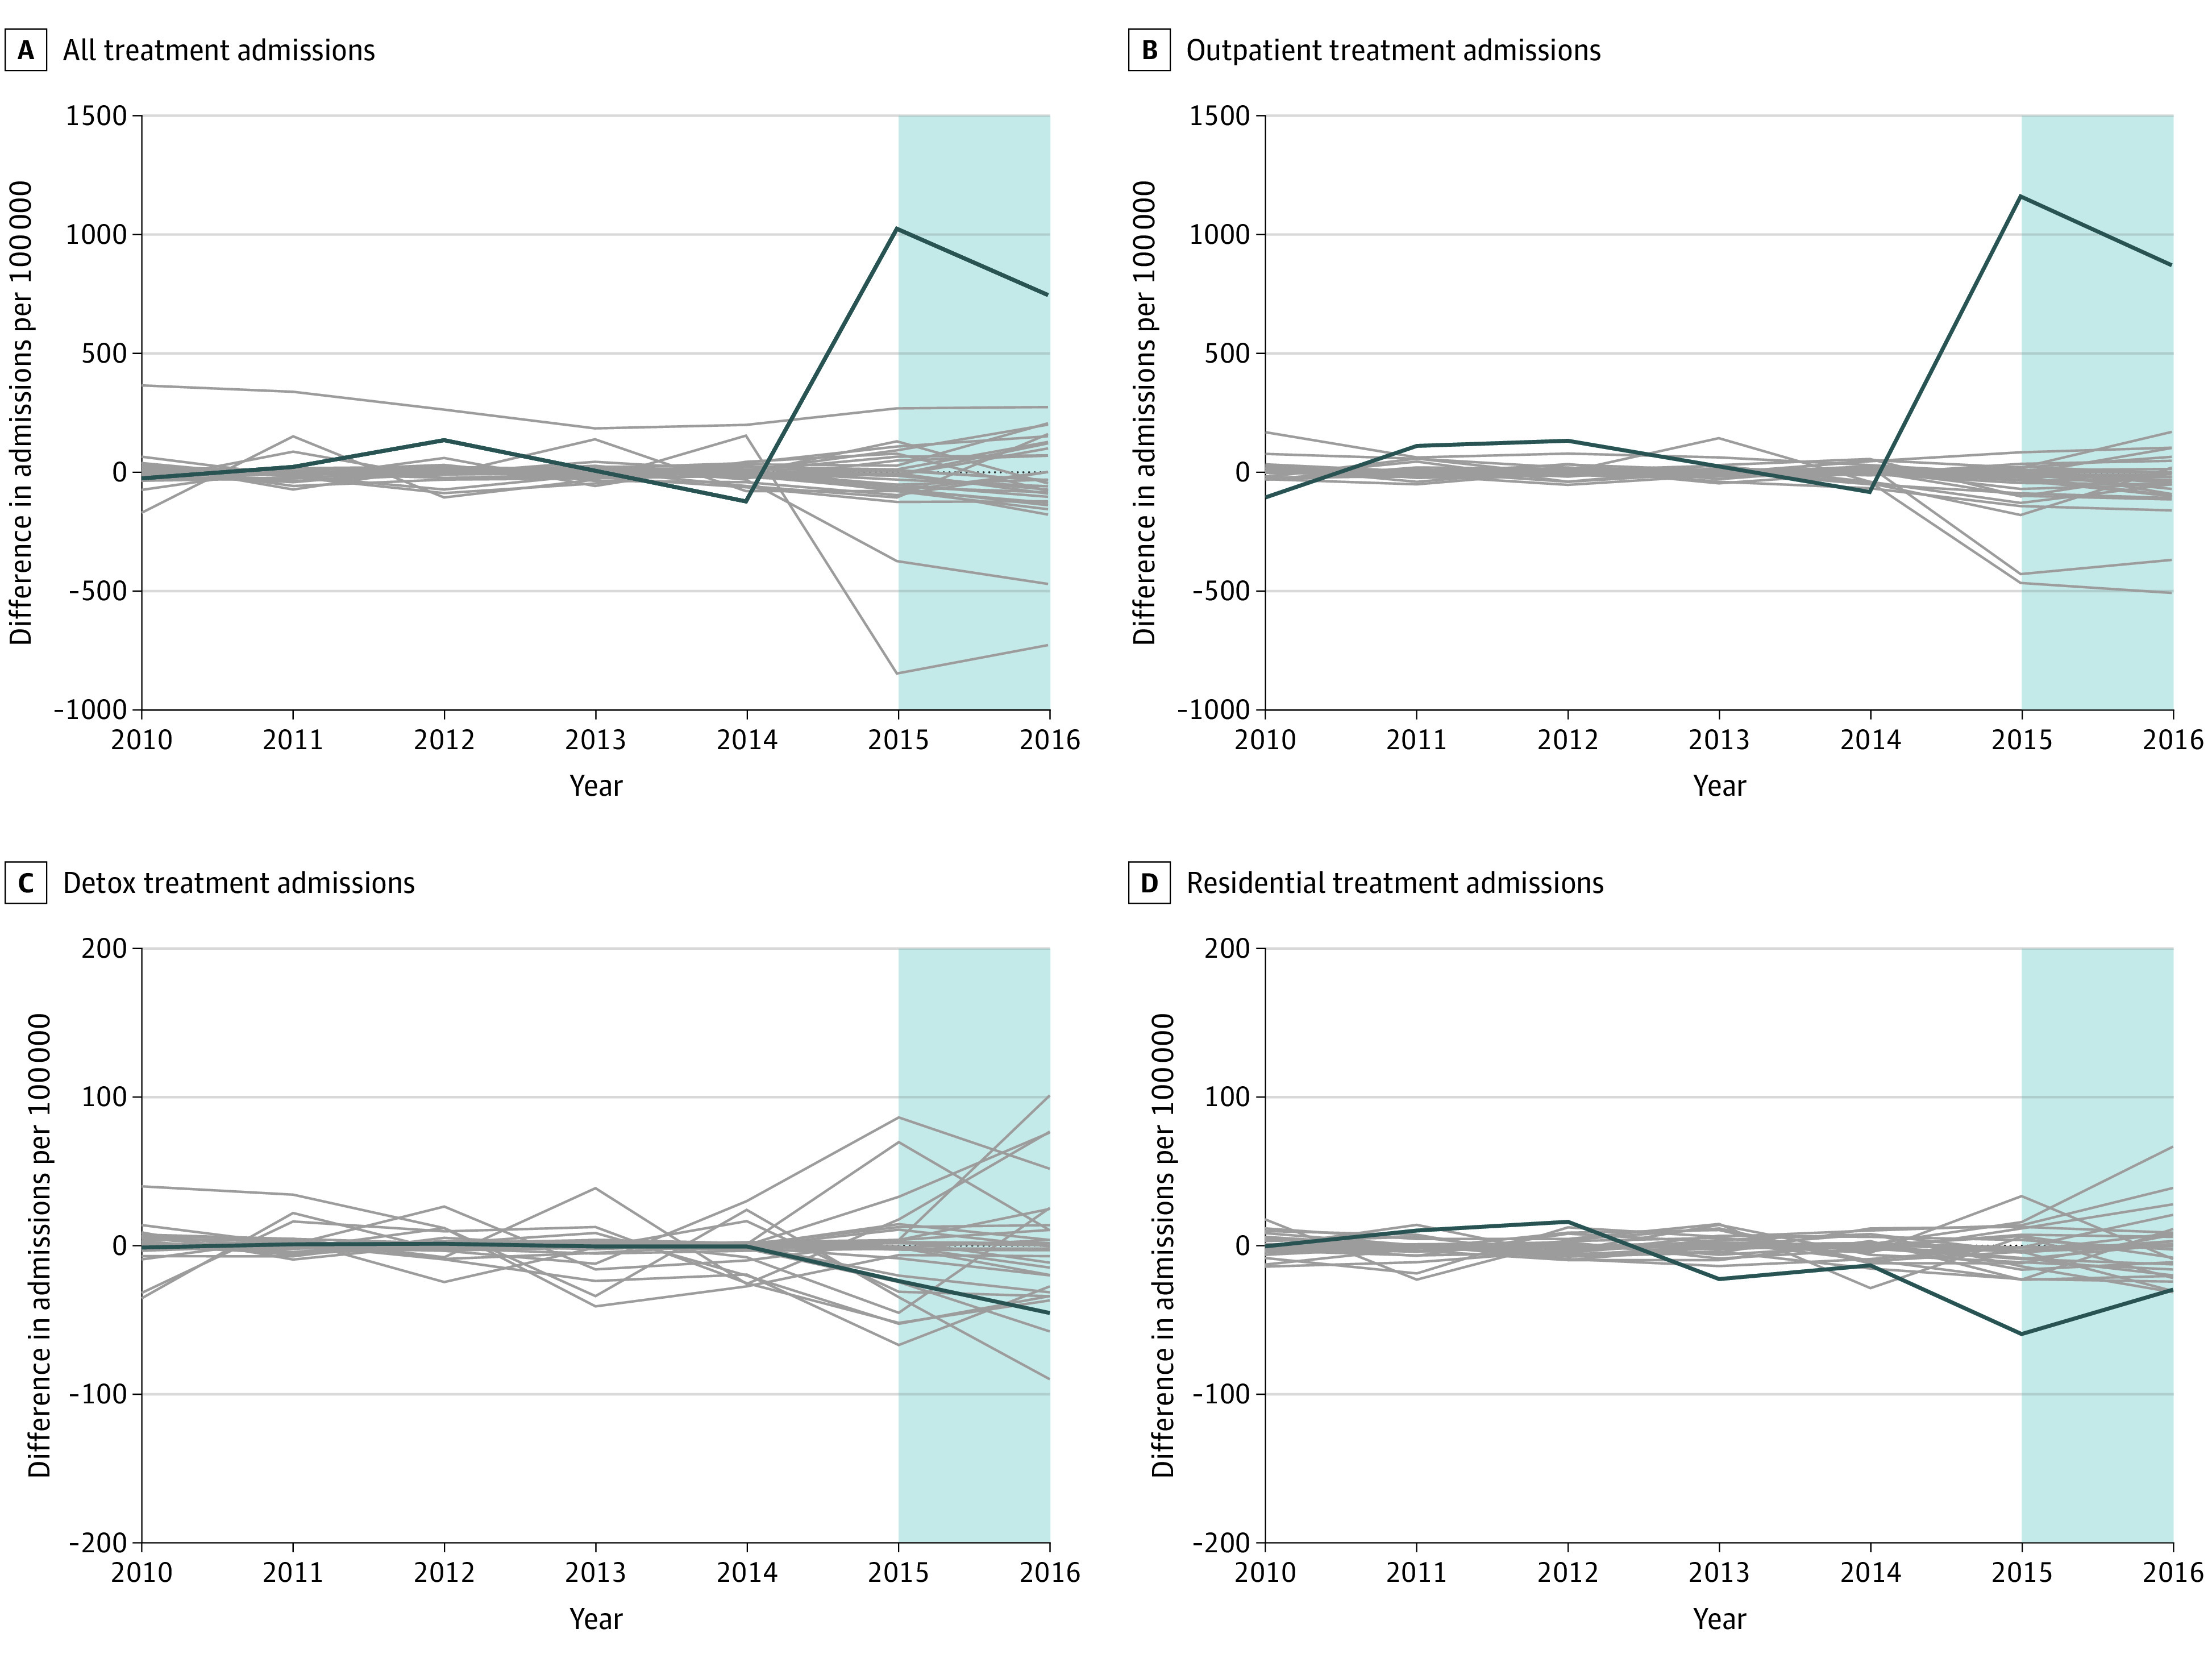
Figure 2. Permutation Tests of Admissions for Substance Use Services Overall and by Type of Service Provided in Maryland and Synthetic Controls.

Synthetic control is a weighted average of units (ie, states) in the donor pool, with weights chosen by a data-driven algorithm so that pretrends in covariates and/or outcomes are as similar as possible between the treated unit and synthetic control. The blue shaded area indicates the postperiod (2015 and 2016). Gray lines represent the estimated placebo differences in outcomes between individual control states and their respective synthetic controls.
