. 2020 Jan 15;2(2):605–625. doi: 10.1039/c9na00751b

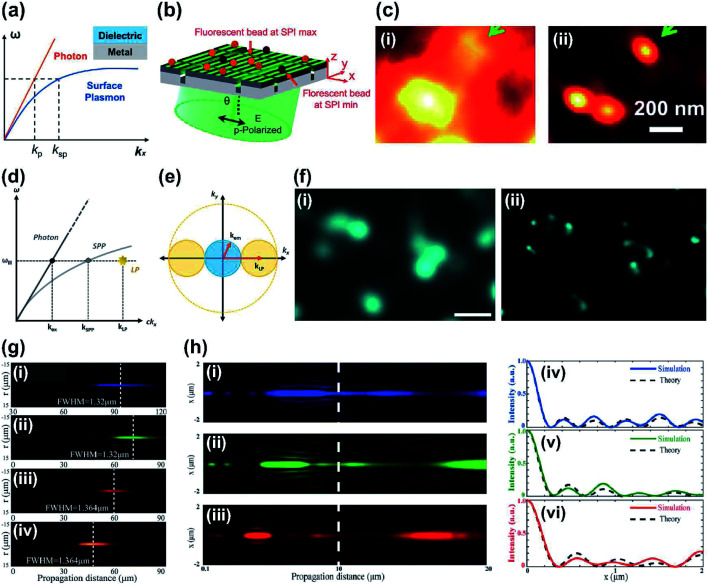
Fig. 7. (a) Schematic of dispersion plot. Surface plasmon (SP) at the interface of metal and dielectric layer represents large wavevector compared to the photon at the same frequency, so the SP has potential to achieve sub-diffraction illumination patterns. (b) Schematic of PSIM with designed metasurface with slits. (c) Imaging results of PSIM using fluorescence beads (diameter: 100 nm). Compared to (i) the conventional image, (ii) PSIM improved resolution by up to 2.6 times. (d) Illustration of the dispersion plot of SP and localized plasmon (LP). (e) Schematic of spatial frequency showing that the LP may improve the spatial resolution of the image high-k information can be captured, then shifted into the observable regime of optical transfer function. (f) Experimental demonstration of LPSIM using fluorescent beads (diameter: 50 nm). (i) The blurred image in conventional wide-field microscope was clearly resolved (ii) with LPSIM (scale bar: 500 nm). (g) Experimental demonstration of light distributions of SOLs along z axis at wavelengths (i) 405 nm, (ii) 532 nm, (iii) 632.8 nm and (iv) 785 nm. (h) Calculated results of achromatic SOLs along z axis at wavelengths of (i) 473 nm, (ii) 532 nm and (iii) 632.8 nm, and their (iv–vi) respective intensity profiles at z = 10 μm. (a–c) Reprinted with permission from ref. 115. Copyright 2014 American Chemical Society. (d–f) Reprinted with permission from ref. 117. Copyright 2017 American Chemical Society. (g) Reprinted with permission from ref. 138. Copyright 2015 John Wiley & Sons, Inc. (h) Reprinted with permission from ref. 143. Copyright 2019 The Optical Society.

Fig. 7