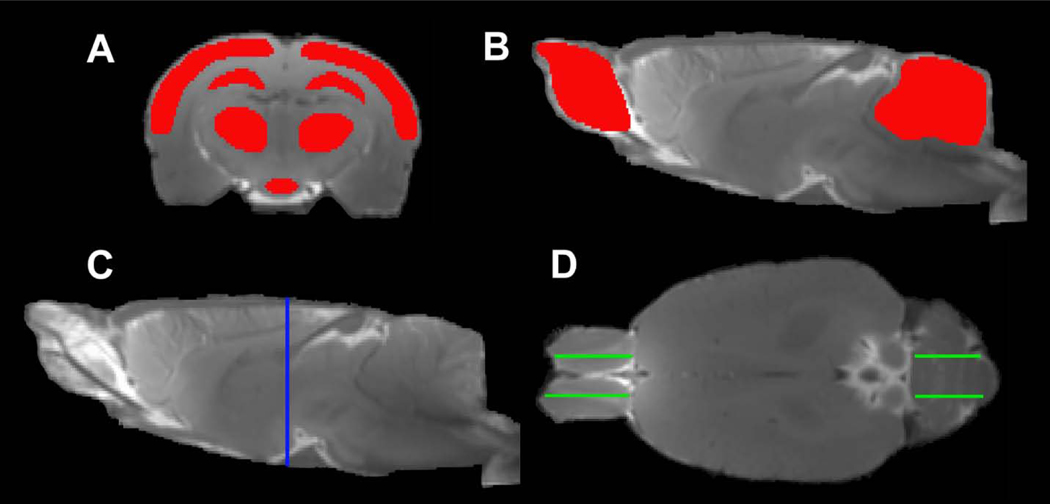
Fig. 1.
Regions of interest (ROIs) (red in A, B) on the coronal (A) and sagittal (B) sections, and the corresponding locations seeing on the sagittal (C, blue line) and axial (D, green lines) sections, respectively. The symmetric ROIs in the same tissue structure (D, green lines in OB and cerebellum) provide average measurements.

