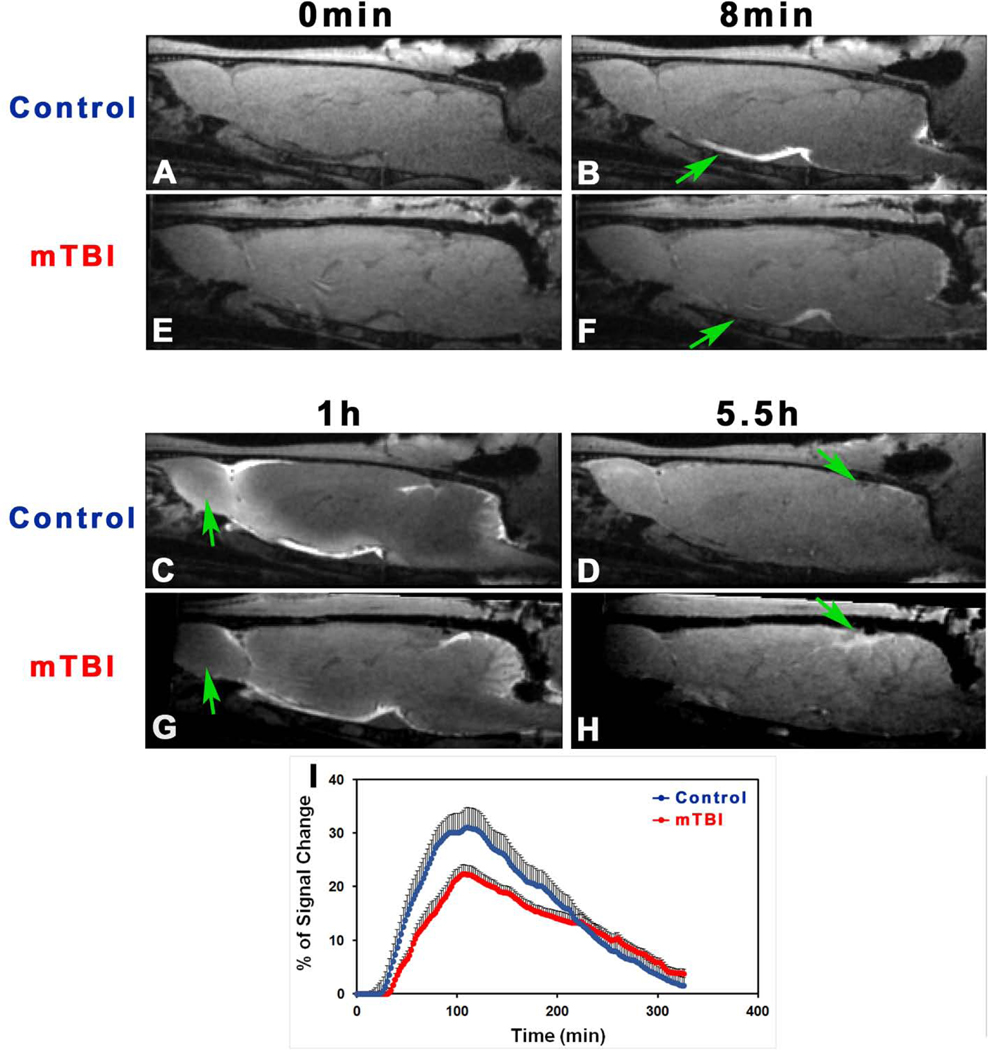
Fig. 3.
T1WIs (A-H) at typical time points showing the progressive transport of contrast agent in the brain with (E-H) and without (A-D) injury (10-weeks post-mTBI). As indicated by arrows, mTBI leads to delayed arrival (B vs. F), restricted amount and extent (C vs. G), and reduced clean-out (D vs. H) of contrast agent compared to the healthy control. Group average TSCs (I, n = 7/group) obtained from symmetric sagittal sections encompassing whole brain present the signal changes along time. Within the major experimental period, lower signal intensity, reflecting reduced amount of contrast agent in the brain, is detected in the mTBI group than in the control group.

