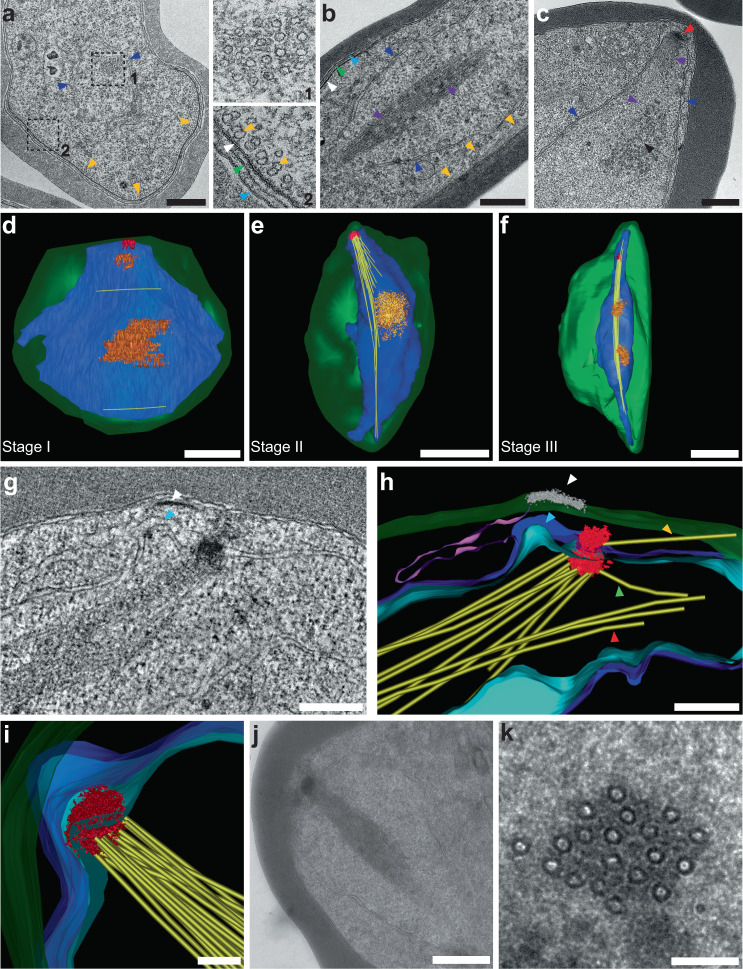
Fig. 1. Multimodal electron microscopy reveals intranuclear microtubules in gametocytes.
a–c Thin section transmission electron microscopy (TEM) images of early-stage gametocytes. a Stage II gametocyte. Inset 1 shows a transverse section through a bundle of microtubules in the nucleus. Inset 2 shows the sub-pellicular microtubules (gold arrowheads), lying underneath the inner membrane complex (IMC, white arrowhead), parasite plasma membrane (PPM, green arrowhead) and parasitophorous vacuole membrane (PVM, cyan arrowhead). b A longitudinal section through a stage III gametocyte illustrating the nuclear microtubule bundle (purple arrowheads) and sub-pellicular microtubules (gold arrowheads). c A longitudinal section through a stage III gametocyte illustrating the nuclear microtubule bundle (purple arrowheads) emanating from an amorphous microtubule organizing centre (MTOC, red arrowhead), interacting with chromatin material (black arrowhead). d–f Whole cell reconstructions from EM serial sections of stage I-III gametocytes. The plasma membrane (green), nuclear membrane (dark blue), nuclear microtubules (yellow), MTOC (red) and the regions of chromatin (orange) are rendered. Translations through the individual sections and rotations of the models at the three stages are presented in Supplementary Movies 1–3. g, h Virtual section and rendered model from an electron tomogram, showing the initial stage of the formation of intranuclear microtubules (yellow) at an MTOC (red) in a stage II gametocyte. The MTOC is close to a bulging region of the nuclear membrane (cyan arrowhead) connected to an endoplasmic reticulum extension (magenta) and is located close to the nascent IMC (white arrowheads). i–k Rendered model and virtual sections from an electron tomogram of a stage III gametocyte. The MTOC (red) is embedded within the nuclear membranes (dark blue and cyan). Pixel size, x, y, z: d 0.86 × 0.86 × 100 nm; e, f 1.16 × 1.16 × 100 nm. Scale bars: a–c = 500 nm; d–f = 2 μm; g = 300 nm, h = 300 nm, i = 500 nm, j = 200 nm, k = 100 nm. Translations through the individual sections and rotations of the models are presented in Supplementary Movies 4 and 5. Figure 1a–c experiments were performed 3 times. Figure 1g–k experiments were performed 3 times (5 tomograms) from 3 different preparations.

