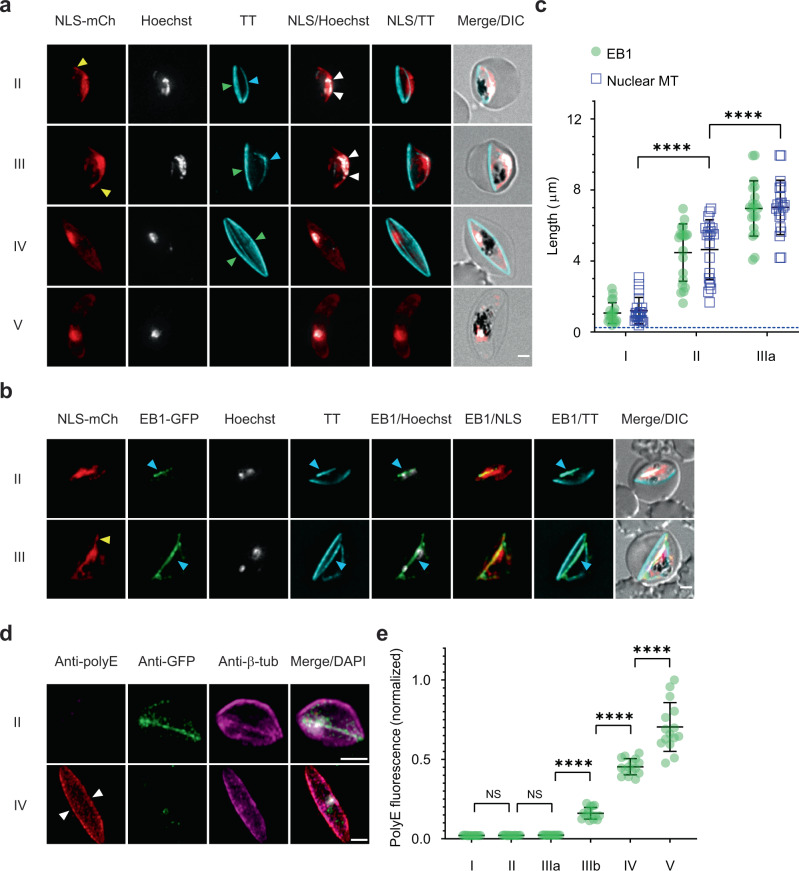
Fig. 2. End-binding protein-1 preferentially associates with the nuclear microtubules, while sub-pellicular microtubules are polyglutamylated.
a Live-cell fluorescence imaging of stage II-V gametocytes transfected with the nuclear localisation signal (NLS)-mCherry reporter. NLS-mCherry (NLS-mCh, red) labels the elongated nucleus, with pointed extensions (yellow arrowheads). Subpellicular (green arrowheads) and nuclear (cyan arrowheads) populations of microtubules are labelled with Tubulin Tracker (TT, cyan). The nucleus contracts to a more spherical morphology and the nuclear and sub-pellicular microtubule populations are disassembled in stage V gametocytes. The chromatin (Hoechst, grayscale) is present as punctate features in the nucleus (white arrowheads). b Live-cell fluorescence imaging of stage II/III gametocytes in the PfEB1-GFP/NLS-mCherry co-transfectant parasite line. NLS-mCherry (NLS-mCh, red) delineates the nucleus; and PfEB1-GFP (EB1-GFP, green) is in the same compartment. Chromatin (Hoechst, grayscale) is distributed along the nuclear microtubules. (See Tubulin Tracker (TT, cyan) overlap with PfEB1-GFP, cyan arrows). Additional images are presented in Supplementary Fig. 3d. c Quantitative analysis of the contour lengths for the PfEB1-GFP (EB1) and nuclear microtubules (MT) labelled with Tubulin Tracker (mean ± SD is shown; n = 20 cells per stage). Differences in the length of nuclear microtubule features were evaluated by two-way ANOVA Tukey’s test, ****p < 0.0001. The blue dashed line indicates the limit of resolution (250 nm) of the microscope. d Images showing that the nuclear microtubules (as marked by anti-GFP (PfEB1-GFP), green) are depolymerised and the subpellicular microtubules (white arrowheads) are modified with polyglutamate (polyE, red) in stage IV gametocytes. Anti-β-tubulin (anti-β-tub, magenta) labels both nuclear and subpellicular microtubules. The chromatin was labelled with DAPI (grayscale). e Quantitative analysis of anti-polyE fluorescence intensity at different stages of development (mean ± SD is shown; n = 15 cells). Differences in polyE fluorescence signal were determined using a paired one-way ANOVA Tukey’s, I vs. II and II vs. IIIa: NS > 0.9999; IIIa vs. IIIb, IIIb vs. IV and IV vs. V: ****p < 0.0001. Differential interference contrast (DIC) images are shown. Scale bars: 2 μm. Additional images are presented in Supplementary Fig. 4d. Source data for Fig. 2c, e is provided in the Source Data file.

