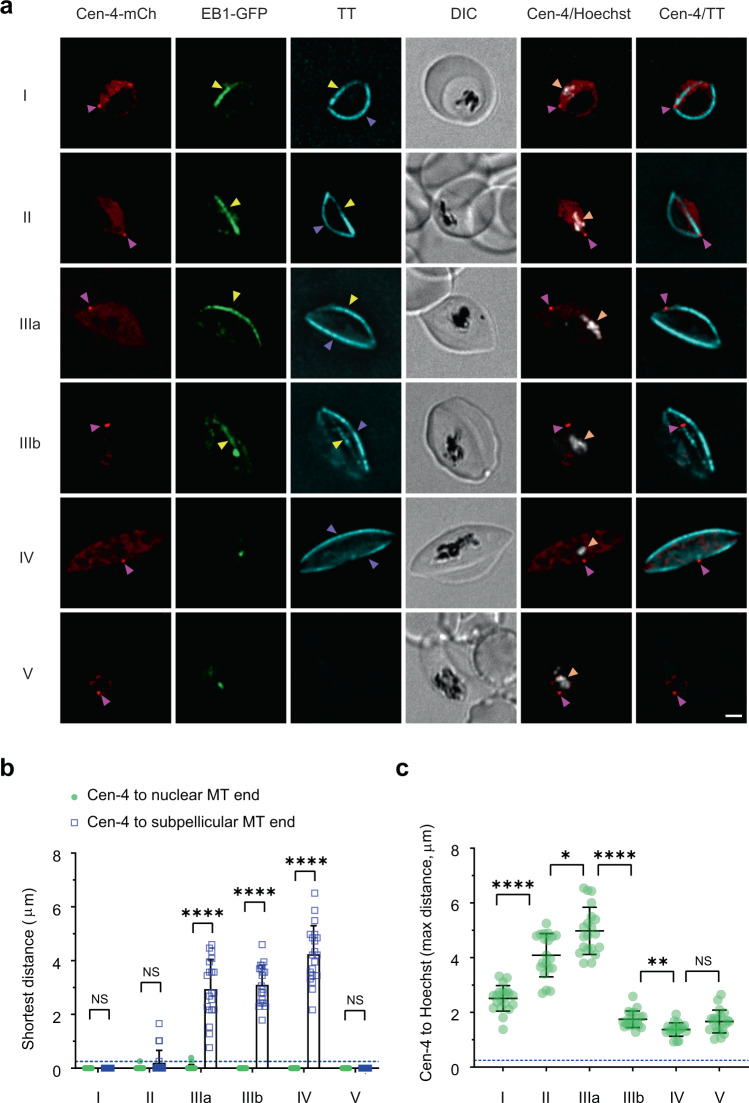
Fig. 3. The gametocyte MTOC is a centriolar plaque equivalent.
a Live-cell fluorescence imaging of stage I-V gametocytes in the PfEB1-GFP/Pfcentrin-4-mCherry co-transfectant parasite line. Pfcentrin-4-mCherry (Cen-4-mCh, red, magenta arrows) delineates the punctate centriolar plaque and PfEB1-GFP-decorated (EB1-GFP, green)/Tubulin Tracker (TT, cyan)-labelled nuclear microtubules (yellow arrowheads) appear to emanate from this structure in early stage gametocytes (stage I, II). As the gametocyte develops, the sub-pellicular microtubule population (purple arrowheads) appears to move away from the Pfcentrin-4-mCherry punctum (stage III). In stage IV, the sub-pellicular microtubules form a cage around the gametocyte while the nuclear microtubules collapse. Hoechst (grayscale, orange arrowheads) is used to label chromatin. Differential interference contrast (DIC) images are shown. Scale bars: 2 μm. Additional images are presented in Supplementary Fig. 6a, b. b, c Quantitative analysis of the shortest distance between the Pfcentrin-4-mCherry (Cen-4) puncta and closest ends of the nuclear and subpellicular microtubules (MT) (b; mean ± SD is shown, n = 20 cells) and maximum distance between the Pfcentrin-4-mCherry (Cen-4) punctum and the furthermost Hoechst feature (c; mean ± SD is shown, n = 20 cells). Differences in the shortest distances b and maximum distance c were determined by two-way and paired one-way ANOVA Tukey’s test, respectively. In Fig. 3b, I: NS > 0.9999, II: NS = 0.9918, IIIa, IIIb, IV: ****p < 0.0001, V: NS > 0.9999. In Fig. 3c, I vs. II: ****p < 0.0001, II vs. IIIa: *p = 0.0257, IIIa vs. IIIb: ****p < 0.0001, IIIb vs. IV: **p = 0.0019, IV vs. V: NS = 0.1240. The blue dashed lines indicate the limit of resolution (250 nm) of the microscope. Source data for Fig. 3b, c is provided in the Source Data file.

