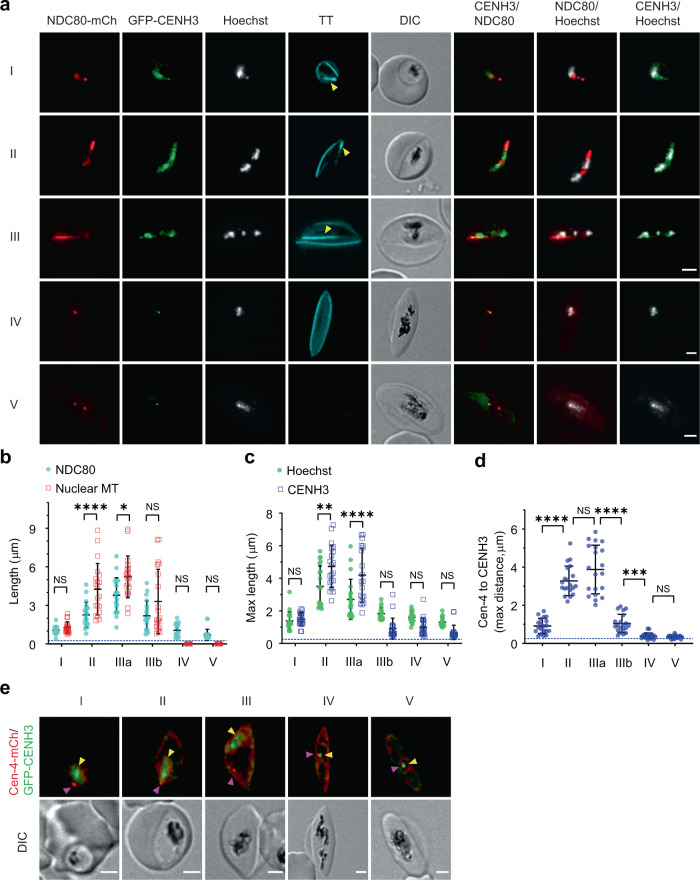
Fig. 4. Chromatin is repositioned along the nuclear microtubules in association with the centromeres and kinetochores.
a Live cell imaging of stage I-V gametocyte transfectants expressing PfNDC80-mCherry (NDC80-mCh, kinetochore marker; red), GFP-PfCENH3 (GFP-CENH3; CENH3; centromere marker; green) and counterstained with Hoechst (chromatin; grayscale) and Tubulin Tracker (TT, microtubules; cyan). b Contour length of the fluorescence profiles for PfNDC80-mCherry and nuclear microtubules (nuclear MT, marked by Tubulin Tracker with yellow arrows in Fig. 4a) (mean ± SD is shown, n = 20 cells). Statistical difference was determined by two-way ANOVA Tukey’s test. I: NS > 0.9999; II: ****p < 0.0001; IIIa: *p = 0.0132; IIIb: NS = 0.1481; IV: NS = 0.2092; V: NS = 0.8042. c Maximum length for the GFP-PfCENH3 and Hoechst labelling profiles (mean ± SD is shown, n = 20 cells). Statistical difference was assessed by two-way ANOVA Tukey’s test. I: NS < 0.9999; II: **p = 0.0011; IIIa: ****p < 0.0001; IIIb: NS = 0.0633; IV: NS = 0.5673; V: NS = 0.5106. d Maximum distance between the Pfcentrin-4-mCherry (Cen-4) and the GFP-PfCENH3 features (mean ± SD is shown, n = 20 cells per stage) in the Pfcentrin-4-mCherry/GFP-PfCENH3 co-transfectants. Statistical difference was analyzed by paired one-way ANOVA Tukey’s test. I vs. II: ****p < 0.0001; II vs. IIIa: NS = 0.2030; IIIa vs. IIIb: ****p < 0.0001; IIIb vs. IV: ***p = 0.0004; IV vs. V: NS = 0.6631. e Live cell imaging of Pfcentrin-4-mCherry (Cen-4-mCh, red) and GFP-PfCENH3 (GFP-CENH3, green) transfectants. Differential interference contrast (DIC) images are shown. Scale bars: 2 μm. Additional images and label pairings are presented in Supplementary Fig. 10. Source data for Fig. 4b–d is provided in the Source Data file.

