. 2020 Nov 30;3(2):528–537. doi: 10.1039/d0na00665c

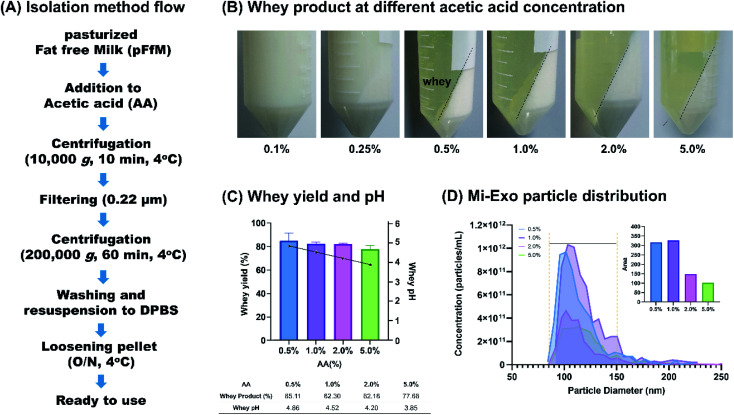
Fig. 1. Optimized Mi-Exo isolation. (A) Overall Mi-Exo isolation method flow. (B) Whey product treated with different acetic acid concentrations of 0, 0.25, 0.5, 1.0, 2.0, and 5.0%. Dashed line distinguishes between whey and casein. (C) Whey yield and pH. Percentage of whey yield was calculated using the following equation: whey yield (%) = (Wv/Mv) × 100 (Wv, output volume of whey; Mv, input volume of milk). (D) Size distribution included the particle diameter, and the concentration in the upper-right graph shows the area range 80–150 nm (yellow dashed lines) of Mi-Exo concentration treated with each AA (%). Area was measured using ImageJ software (NIH, USA). All results were measured at least three times.

Fig. 1