. 2021 Oct 25;3(24):6762–6796. doi: 10.1039/d1na00447f

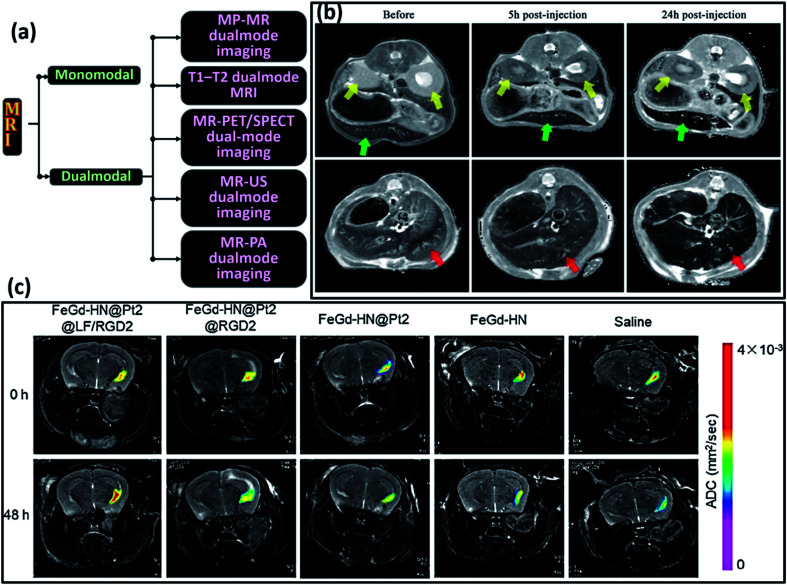
Fig. 15. (a) Classification of different MRI techniques (b) in vivo MRI T2 maps before administration of a 9% dose of contrast agent (NE-SPIONs 4 h) and 5 and 24 h after injection. Each image shows axial sections through the abdominal region of mice. Kidneys, spleen, and liver are, respectively, indicated by yellow, green, and red arrows. Reproduced from ref. 195 with permission from American Chemical Society, copyright 2019. (c) Therapeutic efficacy of ferroptosis therapy (FT) in orthotopic brain-tumor-bearing mice measured by diffusion weighted MRI. Apparent diffusion coefficient (ADC) parametric maps of the orthotopic brain-tumor-bearing mice before or after treatment with FeGd-HN@Pt2@LF/RGD2, FeGd-HN@Pt2@RGD2, FeGd-HN@Pt2, FeGd-HN, or saline. Reproduced from ref. 199 with permission from American Chemical Society, copyright 2018.

Fig. 15