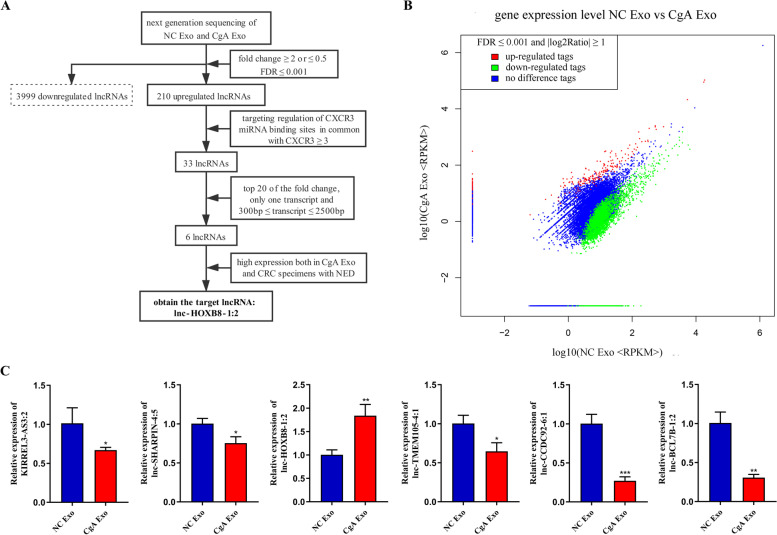
Fig. 4.
Identification of lnc-HOXB8-1:2 in exosomes. A, The diagram of screening target lncRNAs. B, Gene distribution map of lncRNAs with a fold change ≥ 2 or ≤ 0.5 and FDR ≤ 0.001 from NC Exo and CgA Exo. log2Ratio, log base 2 of the fold change; |log2Ratio|≥ 1, the fold change ≥ 2 or ≤ 0.5; FDR, false discovery rate; up/downregulated tag, the expression of a gene in CgA Exo was upregulated/downregulated compared to that in NC Exo. C, The expression of 6 selected lncRNAs was measured in NC Exo and CgA Exo via qRT–PCR, and lnc-HOXB8-1:2 was highly expressed in CgA Exo. *, P < 0.05; **, P < 0.01; ***, P < 0.001; NC, negative control; CgA, chromogranin A; Exo, exosomes

