. 2022 Mar 2;4(7):1815–1826. doi: 10.1039/d2na00044j

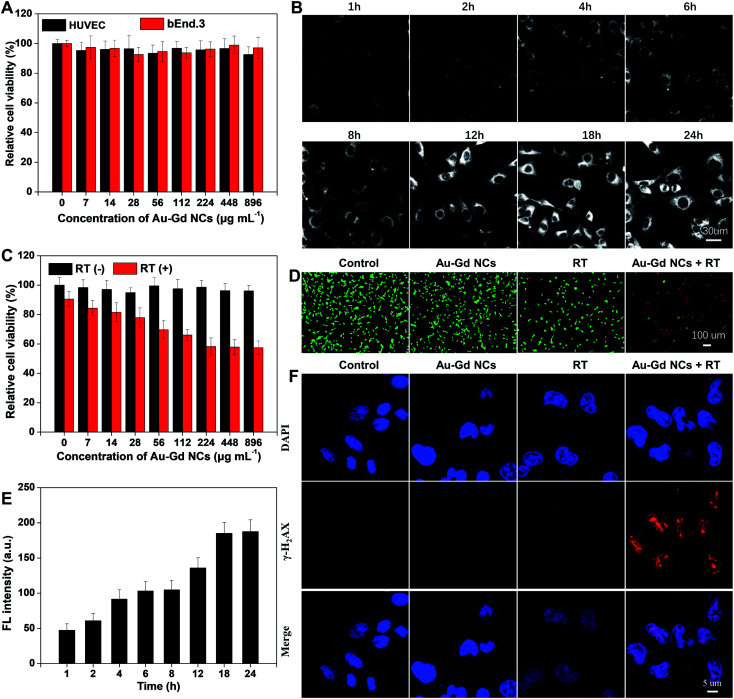
Fig. 2. In vitro biocompatibility, cellular uptake and sensitization of cancer cell radiotherapy. (A) relative cell viabilities of HUVEC and bEnd.3 cells incubated with different concentrations of Au–Gd NCs. (B) NIR-II fluorescence microscopy images of C6 cells treated with Au–Gd NCs for 1, 2, 4, 6, 8, 12, 18, and 24 h. (C) Relative cell viability of C6 cells incubated with different concentrations of Au–Gd NCs in the RT (−) group and RT (+) group. (D) Calcein-AM/PI staining to visualize the cell viability of C6 cells in four different groups. Scale bar = 100 μm. RT: 6 Gy, 2 Gy min−1. C Au–Gd NCs = 224 μg mL−1. (E) Quantitative analysis of NIR-II fluorescence in b using the Image J software. (F) FL images of γ-H2AX immunofluorescence labelled C6 cells after exposure to X-ray irradiation (6 Gy, 2 Gy min−1). Scale bar = 5 μm.

Fig. 2