. 2019 Mar 27;1(5):1965–1969. doi: 10.1039/c9na00011a

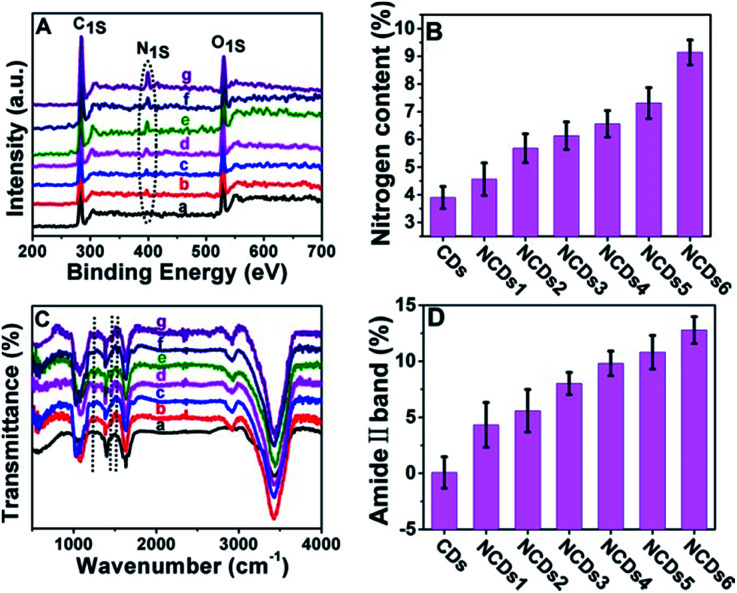
Fig. 2. Characterization of the CDs and NCDs1–NCDs6. (A) Full-scan XPS spectra of the CDs and NCDs1–NCDs6 (from (a to g) CDs; NCDs1; NCDs2; NCDs3; NCDs4; NCDs5; NCDs6). The dashed-dotted line shows the N 1s content in the CDs and NCDs1–NCDs6. (B) The nitrogen content of the CDs and NCDs1–NCDs6. (C) FTIR spectra (from (a to g) CDs; NCDs1; NCDs2; NCDs3; NCDs4; NCDs5; NCDs6). The three dashed-dotted lines correspond, from left to right, to the C–N amine stretching vibrations, the amine III band from C–N bonds and the amide II band from N–H bonds, respectively. (D) The relative intensity of the amide II bands from N–H bonds (the internal standard is C Created by potrace 1.16, written by Peter Selinger 2001-2019 O) of the CDs and NCDs1–NCDs6.

Fig. 2