. 2022 Jun 21;4(15):3272–3281. doi: 10.1039/d2na00262k

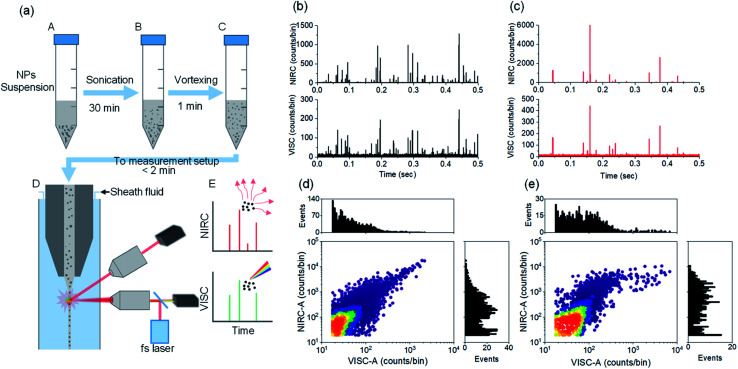
Fig. 2. (a) Schematic of different steps used in the preparation of CDCP suspensions for measurements using the DCMPFC setup. The time between NP suspension preparation and the measurements is kept as short as possible to avoid aggregation. (b) Time traces of photon bursts from ufP90 NPs passing though the laser focus. (c) Time traces of photon bursts from fCB NPs passing through the laser focus. (d) Scatter plot with distribution histogram for VISC-A and NIRC-A of ufP90 showing the distribution of the population of ufP90. (e) Scatter plot with distribution histogram for VISC-A and NIRC-A of fCB showing the distribution of the population of fCB.

Fig. 2