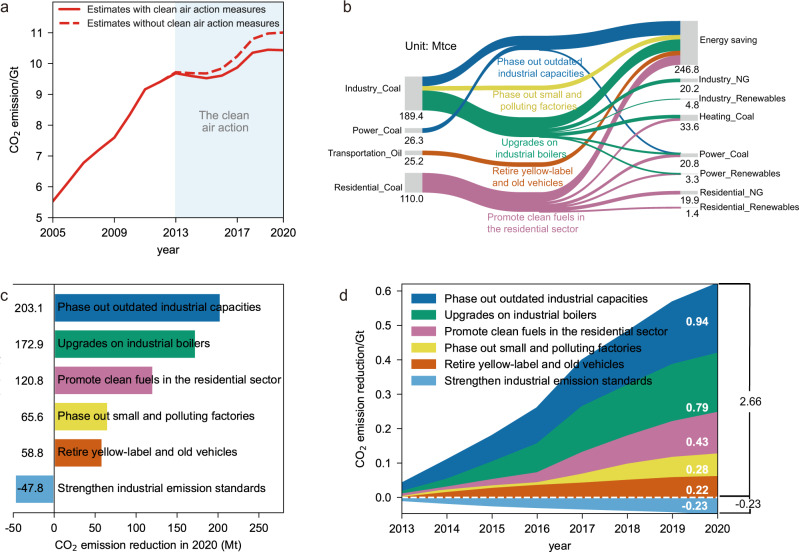
Fig. 2. Change in China’s energy end-use flows and measure-specific contributions to CO2 emission reduction.
a CO2 emission estimates with and without clean air action measures. b Transition in energy structure in China between 2013 and 2020. The transition of energy end-use flows was driven by five co-beneficial measures. The left side represents the reduction of energy consumption in 2020, and the right side represents the attribution of reduced energy consumption to energy savings and transformation into other cleaner energy sources. c Measure-specific CO2 emission reductions in 2020. Negative reduction from the enhancement of industrial emission standards represents the additional CO2 emissions due to application of end-of-pipe technologies. d Accumulated CO2 emission reduction between 2013 and 2020 by each measure. Numbers within graphs show total amounts of CO2 emissions reduction over the period.

