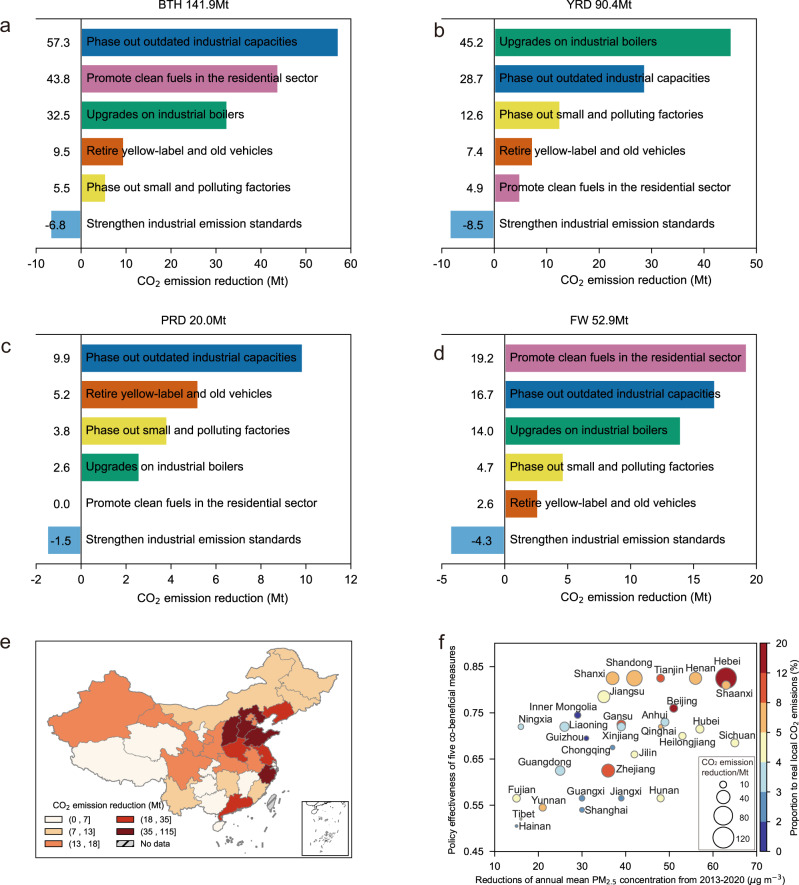
Fig. 3. Regional patterns of CO2 emission reduction co-benefits in 2020.
a–d CO2 emission reduction from six measures in Beijing–Tianjin–Hebei region (BTH), Yangtze River Delta region (YRD), Pearl River Delta region (PRD), and Fenwei Plain region (FW), respectively. e The provincial CO2 emission reduction in 2020. f The relationship between the policy effectiveness, air quality improvement, and CO2 emission reduction. Each bubble in f indicates a province, with the size representing the CO2 emission reduction in 2020 and the color representing the proportion of CO2 emission reduction to real local CO2 emissions in 2020. The policy effectiveness provides a general measure of the policy intensity in a region, with the coefficient value ranging from 0 (very weak) to 1 (very strong), and more details are presented in Supplementary Note 1 and Supplementary Tables 2 and 3.

